Device Scenes
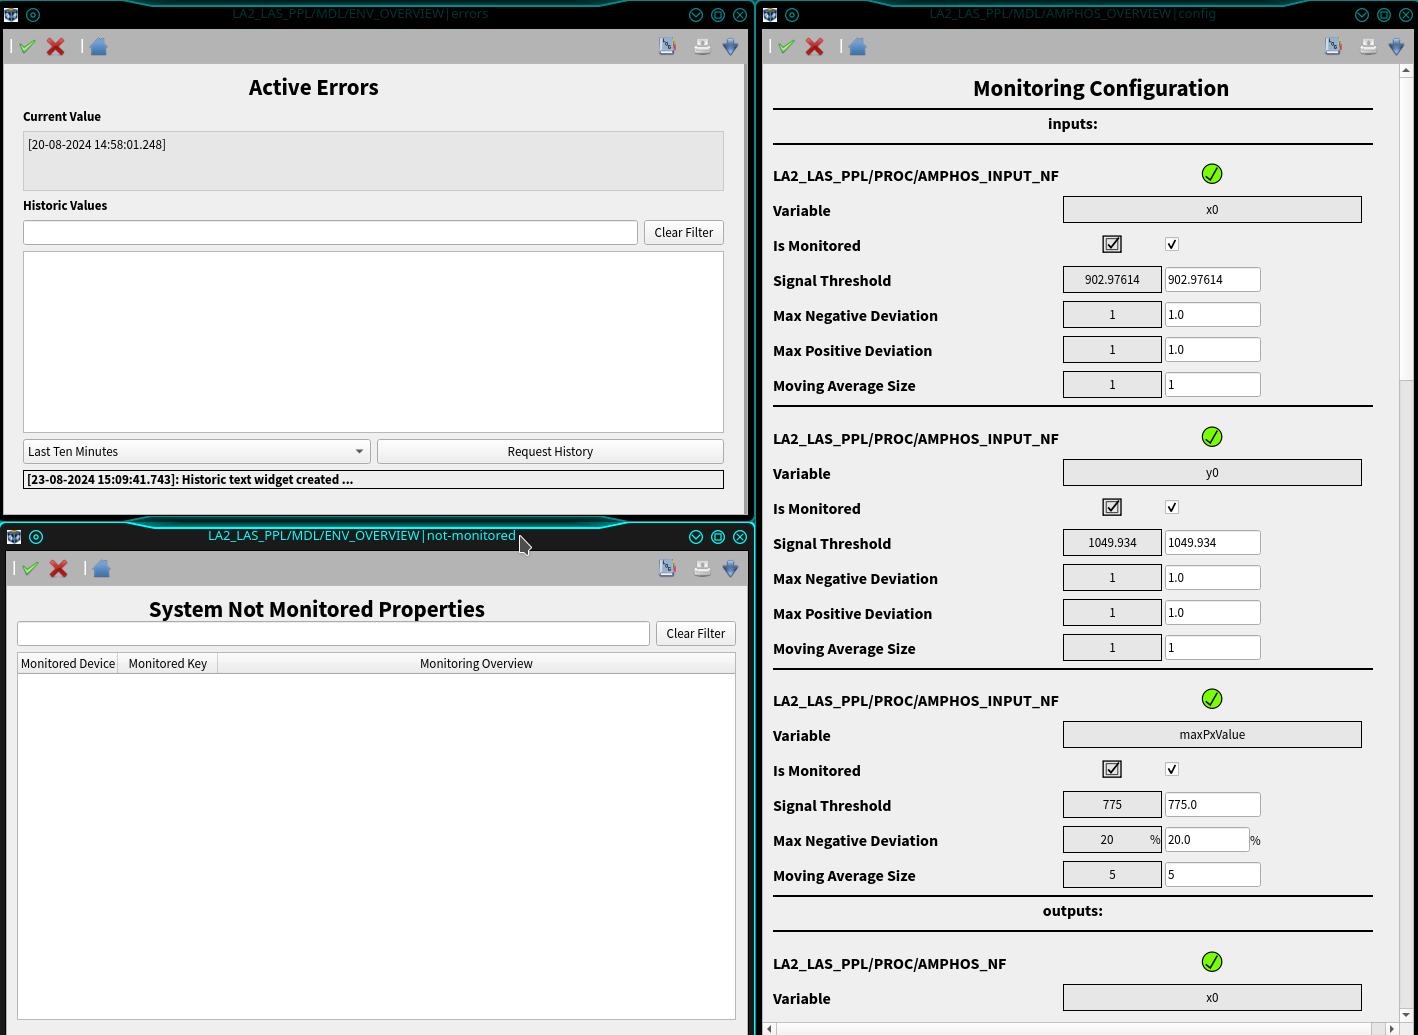
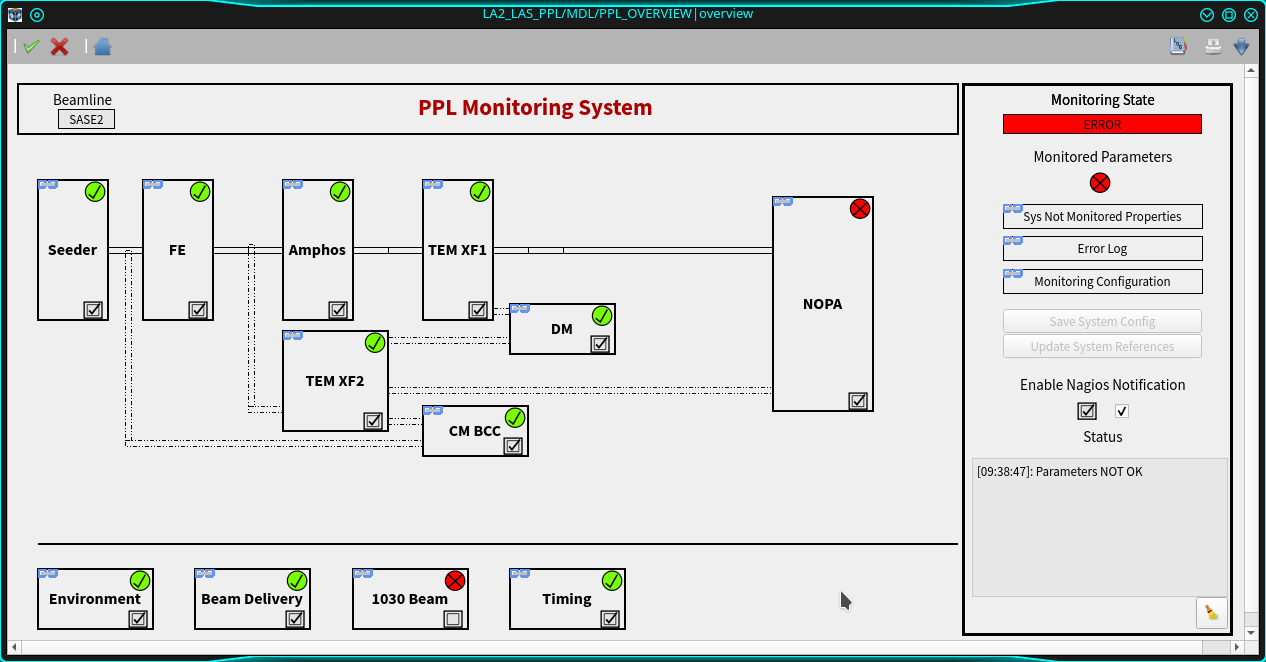
Overview devices have five autogenerated base scenes which provide the full information of the monitored system. Double clicking on the device name in the GUI pops-up the default status scene, which provides a first view of the status of its monitored properties. Clicking on that scene pops-up the overview scene, see Fig. 4, which provides the state of the monitored devices and the link to the scenes displaying the properties in error (Error Log), the properties not monitored (Not Monitored Properties), and to configure the monitoring (Monitoring Config), see Fig. 5:

Fig. 5 Scenes for displaying the properties in error (top-left panel), the not monitored properties (bottom-left panel), and to configure the monitoring (right-panel).
For an optimized layout, visualization base scenes can be overwritten in specific derived devices, as in the case of the main overview scene for LAS systems. An example for the LA2 system is shown in Fig. 6; a similar layout concept can be used in other Karabo systems. In this example, each block represents the status of a monitored Overview subsystem; clicking on its scene-link will open its default scene. Also shown in the block are the isOk status of the corresponding Overview device and the Boolean to enable its monitoring.
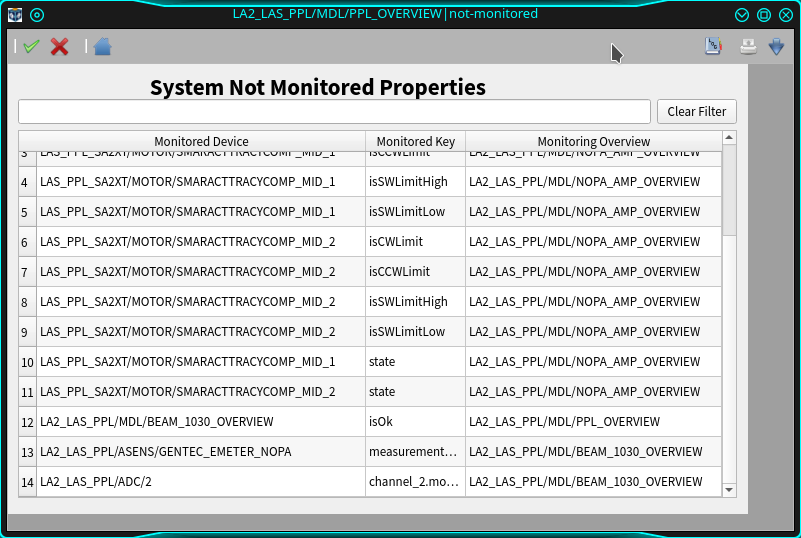
The relevant properties to monitor in an Overview device should be added in its hardcoded configuration; users can anytime disable the monitoring of a property which was initially included in the configuration. The key unmonitored (labeled as Not Monitored Properties) reports those properties; in case the isOk state of an Overview subsystem is included in the monitoring, then that key reports also the properties whose monitoring was disabled in that monitored Overview device. This means that the unmonitored key in the main device shows the properties not monitored in the entire system, see Fig. 7. Each entry of the scene table reports the key of a non-monitored property, the ID of the device device the property belongs to, and the ID of the Overview device in charge of its monitoring.
The scene to tune the configuration of the properties included for monitoring is described in details in the next section.
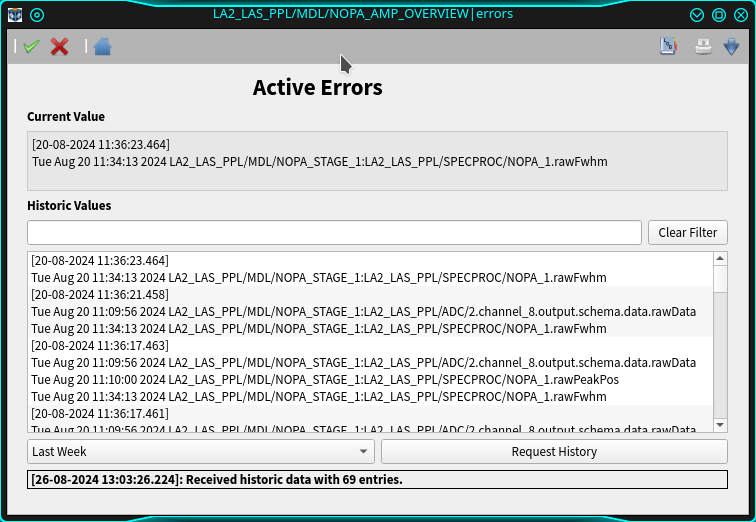
An example of scene showing the properties which are not fulfilling the configured conditions is displayed in Fig. 8. Every time a monitored property goes to error or is recovered from a previous error, the property string activeErrors reporting all properties currently in errors is updated and presented with a new timestamp. Being this information contained in a Karabo string allows the users to visualize the property history up to the last week; The investigation for values older than one week can be done via the Grafana interface to the device property database.


