Dashboards
In Grafana, Dashboards are screens which aggregrate multiple :ref:`panels`_ into logical views. Detailed information on dashboards can be found in the Grafana documentation: https://grafana.com/docs/grafana/latest/features/dashboard/dashboards/. Here we will only give a short introduction on examples how Dashboards are used in the ctrend.xfel.eu context.
Note
Depending on your access rights for a given folder you may not be able to execute or view some of the actions and features described in this section.
Organizing Content via Dashboards
Dashboards are foreseen to be the usual way of grouping related information (panels) within each Team’s folder. As such it is advised that they are given meaningful names, e.g. relating to a certain components, or component types: PP Lasers, Cameras, XGM, … .
Dashboard Layout
Dashboards organize content on a row x column grid. While you can add rows such that scrolling is necessary, keep in mind that you might want to display a Dashboard on overview screens in the hutches and control rooms. Here you likely want everything in view - without scrolling. Check for instance if multiple data sources can be aggregated in the same panel, or if organizing content over multiple dashboarsd may make sense.
Dashboard Variables
At the European XFEL many components are implemented in standardized ways. Hence you will find very similar devices in Karabo for different instruments, or in different component groups. Dashboard variables allow you to parameterize panels, by variables which can be entered on a dashboards. This allows you to use a single panel to display data from similar data sources.
An example of such usage is the parameterization of the general overview dashboards and panels on the Karabo topics, as shown below.
Here the variable refers to different data sources which are then used in the panel to query information for.
Variables can also be used to parameterize e.g. device names.
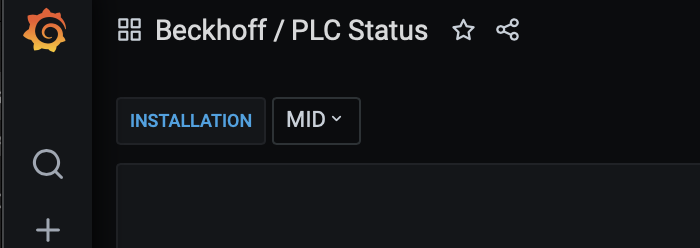
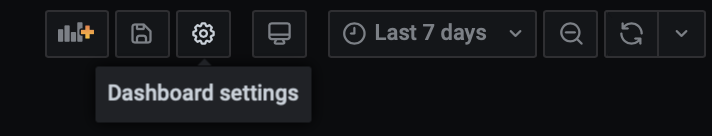
To create a variable for a dashboard, click on the gears symbol to access the dashboard settings.
Then click on “Variables” and “New”. You should now see a screen similar to the following:
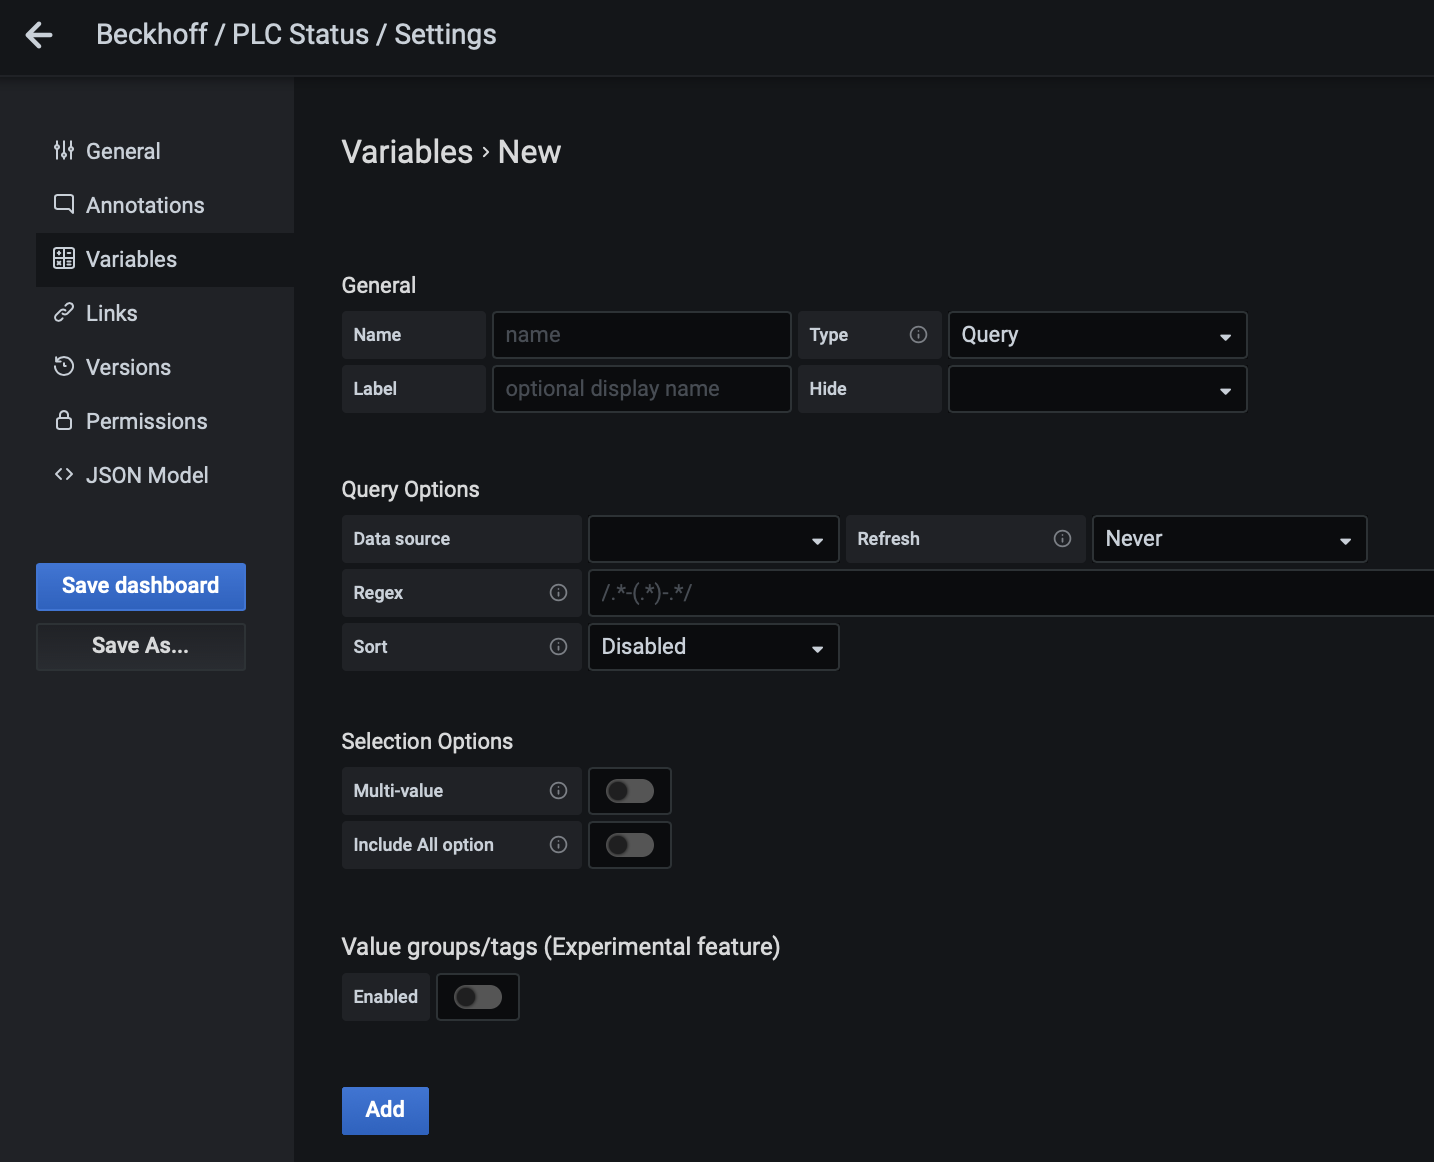
The important fields to edit in this dialog are:
| Name: | give a name to the variable. This is also the parameter name under which you will later refer to the variable. E.g. a variable “INSTALLATION” will be accessible via the parameter $INSTALLATION in panels and queries. For this reason the name should not contain spaces or special characters. In fact, it is advised to use all capital letters with underscores as separators where needed. This will allow you to quickly identify variables e.g. in queries. |
|---|---|
| Type: | determines the options which can be selected for a variable. Common useful types are Query, Datasource, Textbox and Custom. See the example below for how to use each of these. Depending on what you select here the dialog may change in the following. |
Example: Jungfrau Frame Rates
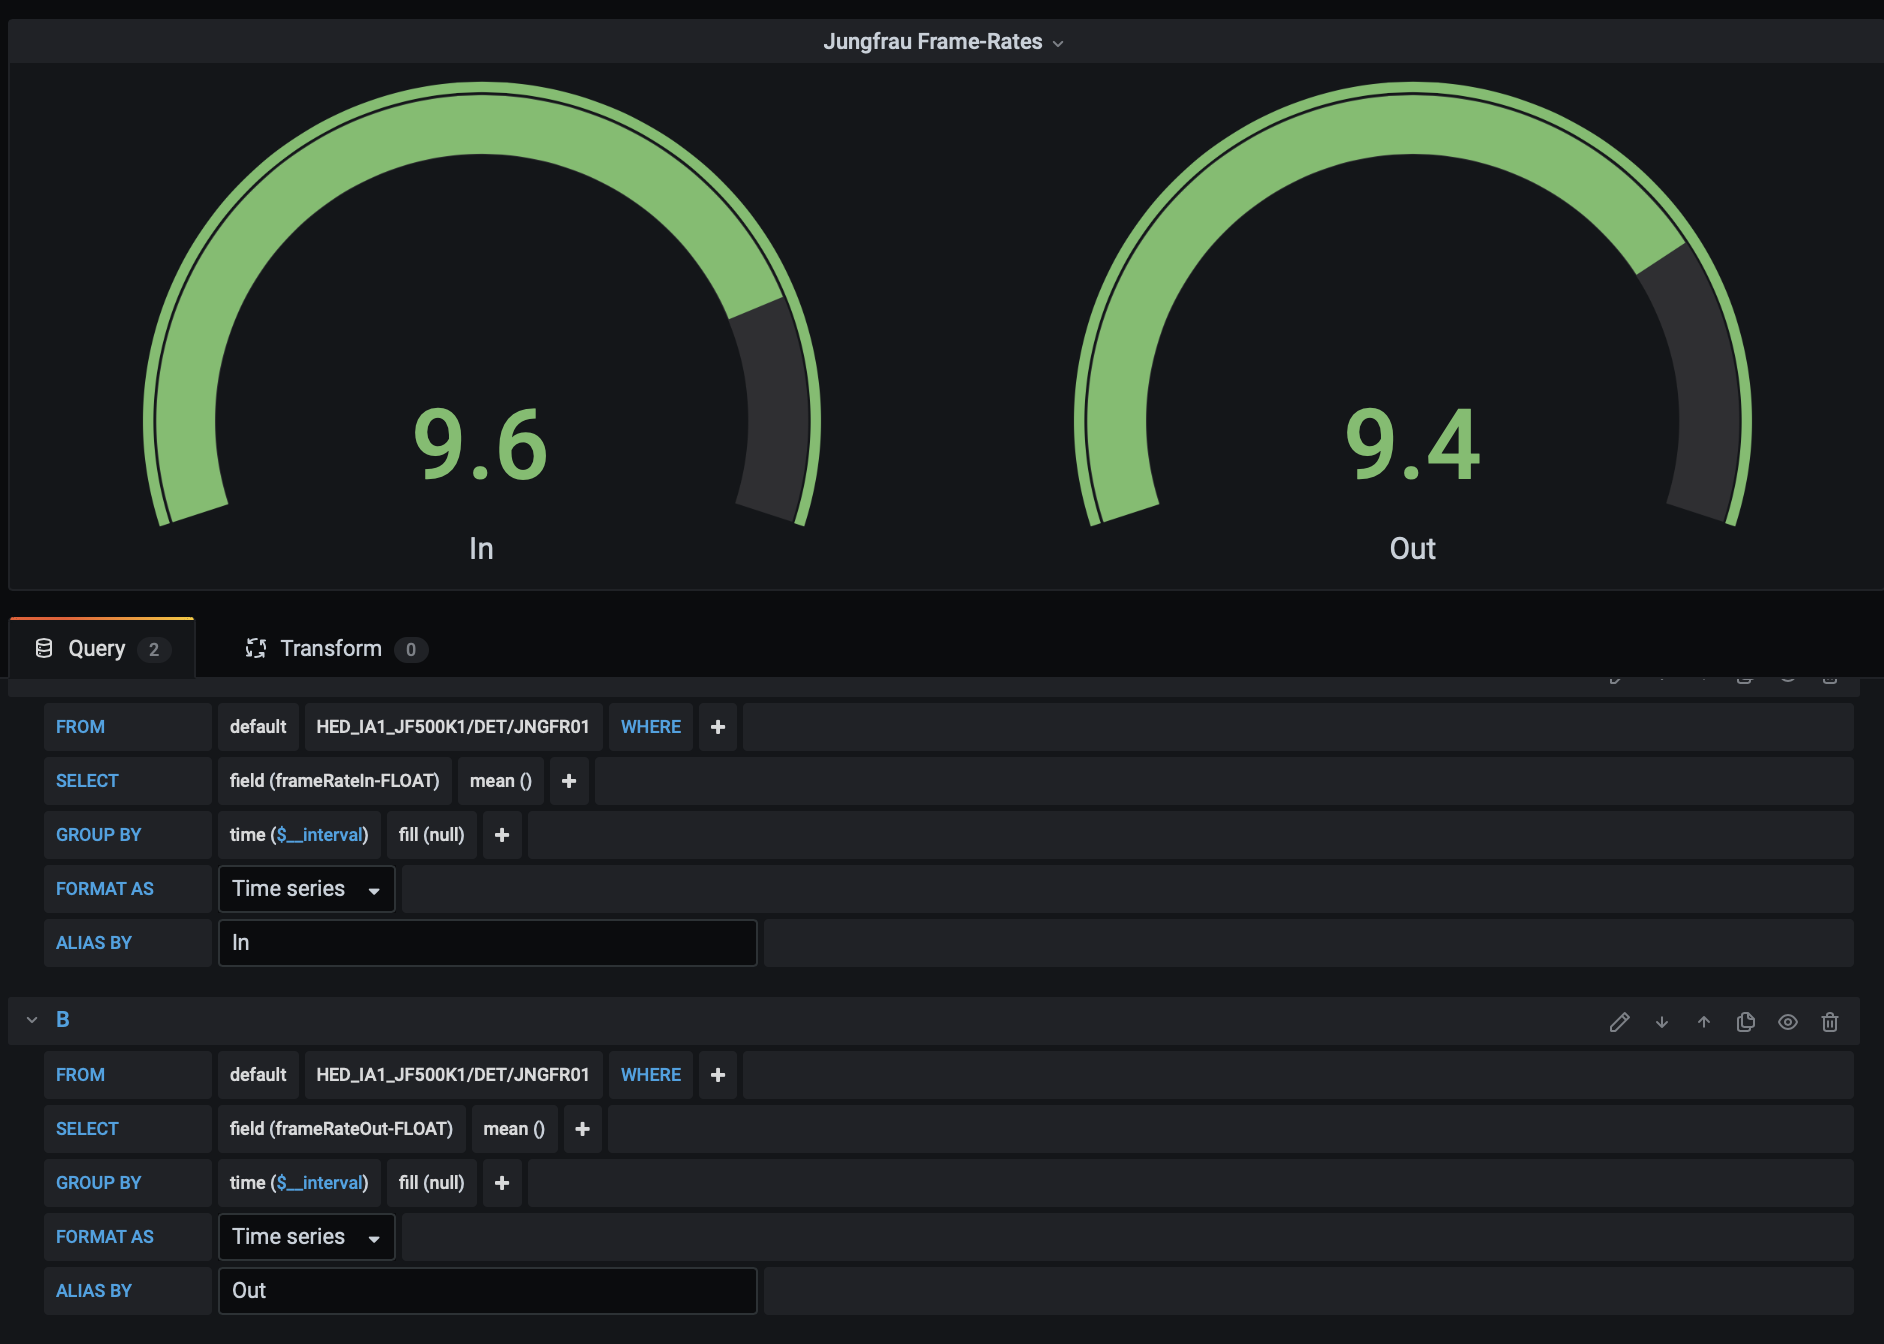
In the following we will use each of the dashboard variable options introduced above to display the last recorded input and output framerates of Jungfrau receiver device.
We start by creating a panel in an otherwise empty dashboard which simply refers to a single Jungfrau receiver device, HED_IA1_JF500K1/DET/JNGFR01 in HED directly:
To accomodate for the four Jungfrau detectors currently availabe at HED, we could either
- add all other detectors into the same panel, or
- create another three panels, for each detector.
We could then do the same for the other instruments with Jungfrau detectors, such as MID, FXE and SPB. Every time a detector is renamed or added, we would then adapt our panels.
Variables allow us to parameterise the dashboard and panels however and reduce this error-prone copy-paste-adapt work.
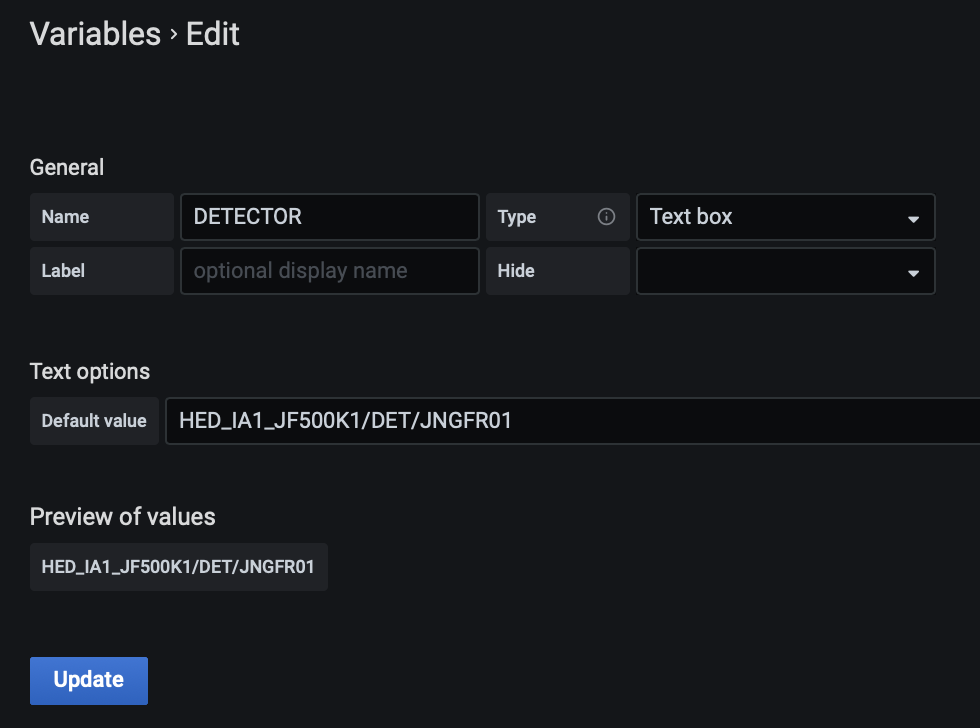
In an first attempt we create a Textbox which allows the user to enter the device id of the Jungfrau detector they are interested in. We already give a meaningful default value as an example. For this we create a variable DETECTOR:
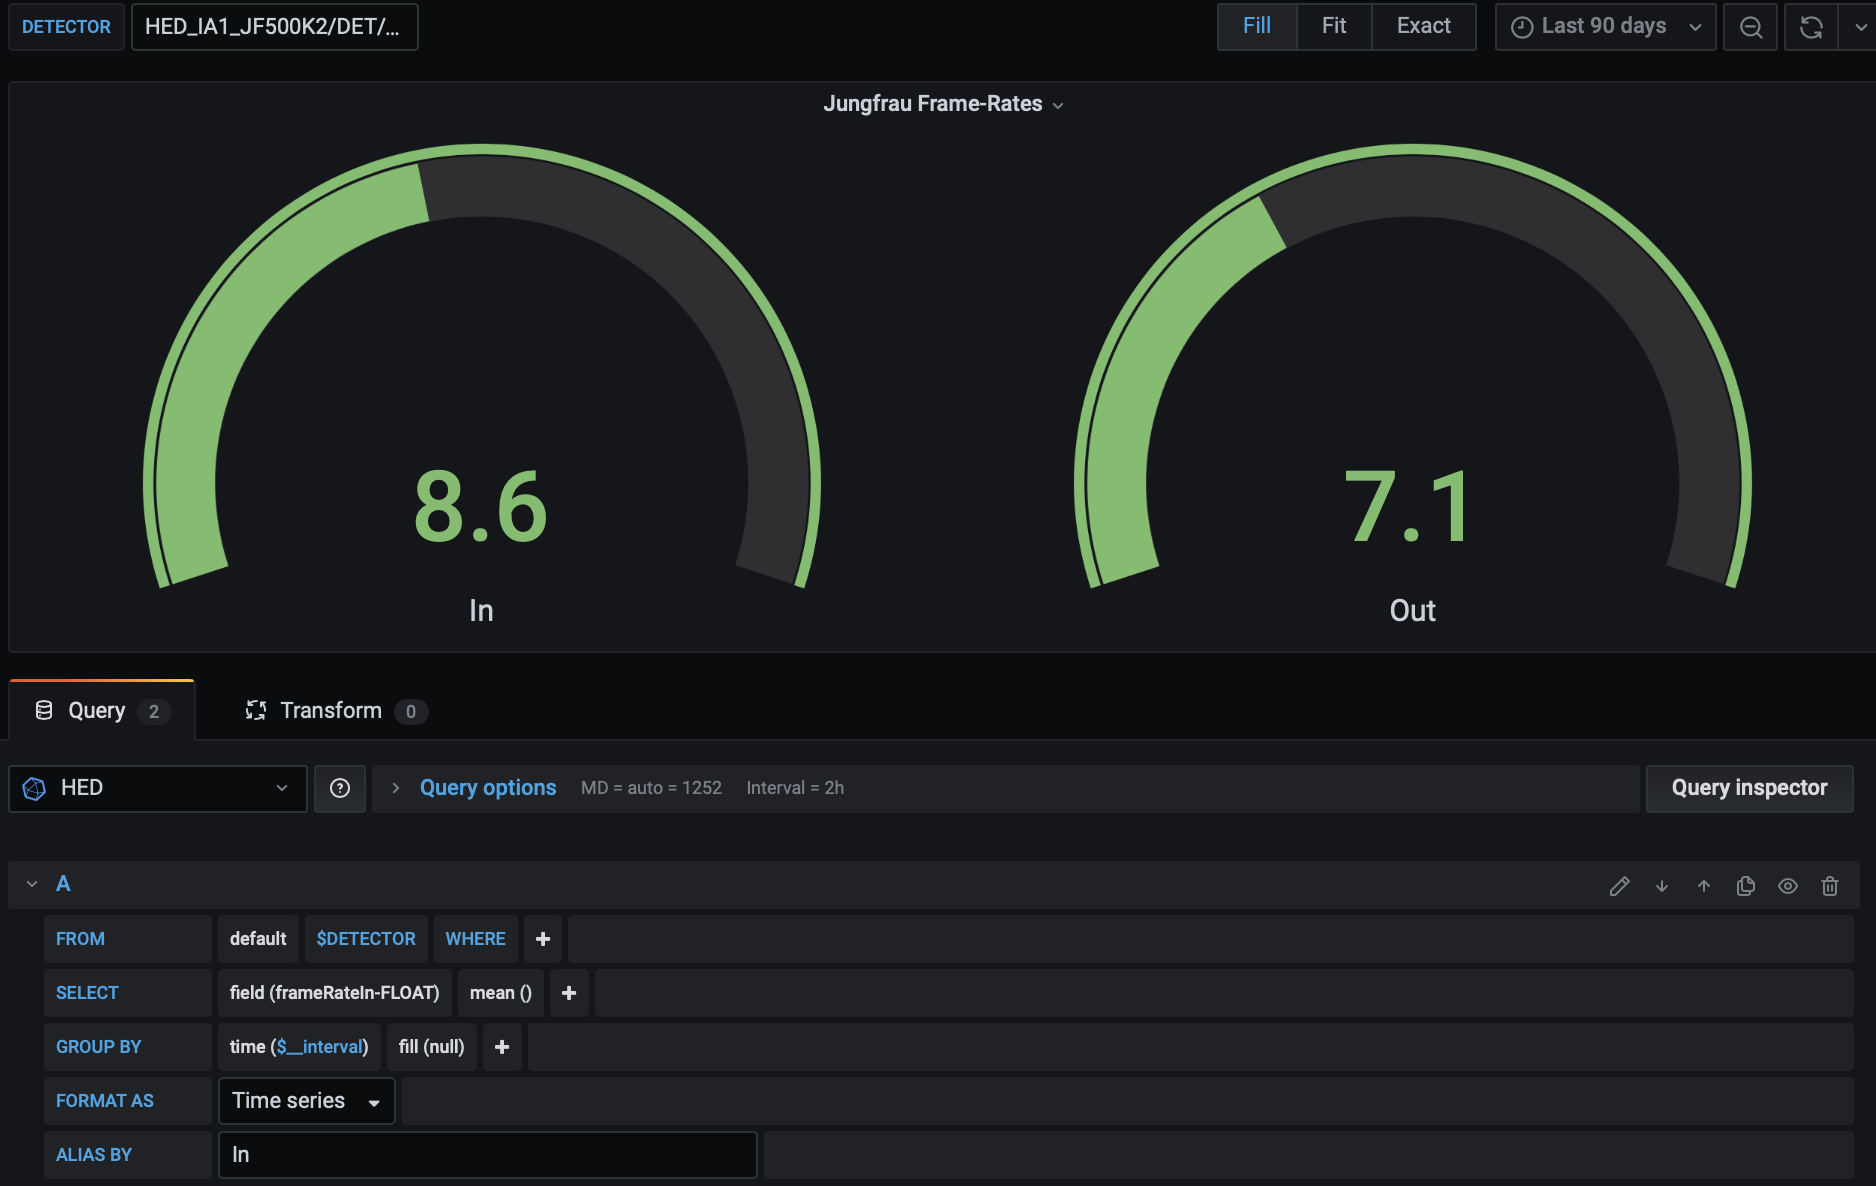
In our panel, we can now refer to this variable via $DETECTOR. We thus adapt our queries to use the the variable as measurement name, rather than fixing it in the query itself:
We can now type a different device id in the text box Grafana created to enter the variable. However, this immediately highlights a down-side of the textbox approach. The text is free-form, and thus, errors can easily occur. If in case of our Jungfrau detector we neglect to adjust both indices in the name, e.g by typing HED_IA1_JF500K2/DET/JNGFR01, while it should be HED_IA1_JF500K2/DET/JNGFR02, no data will be found in the database:
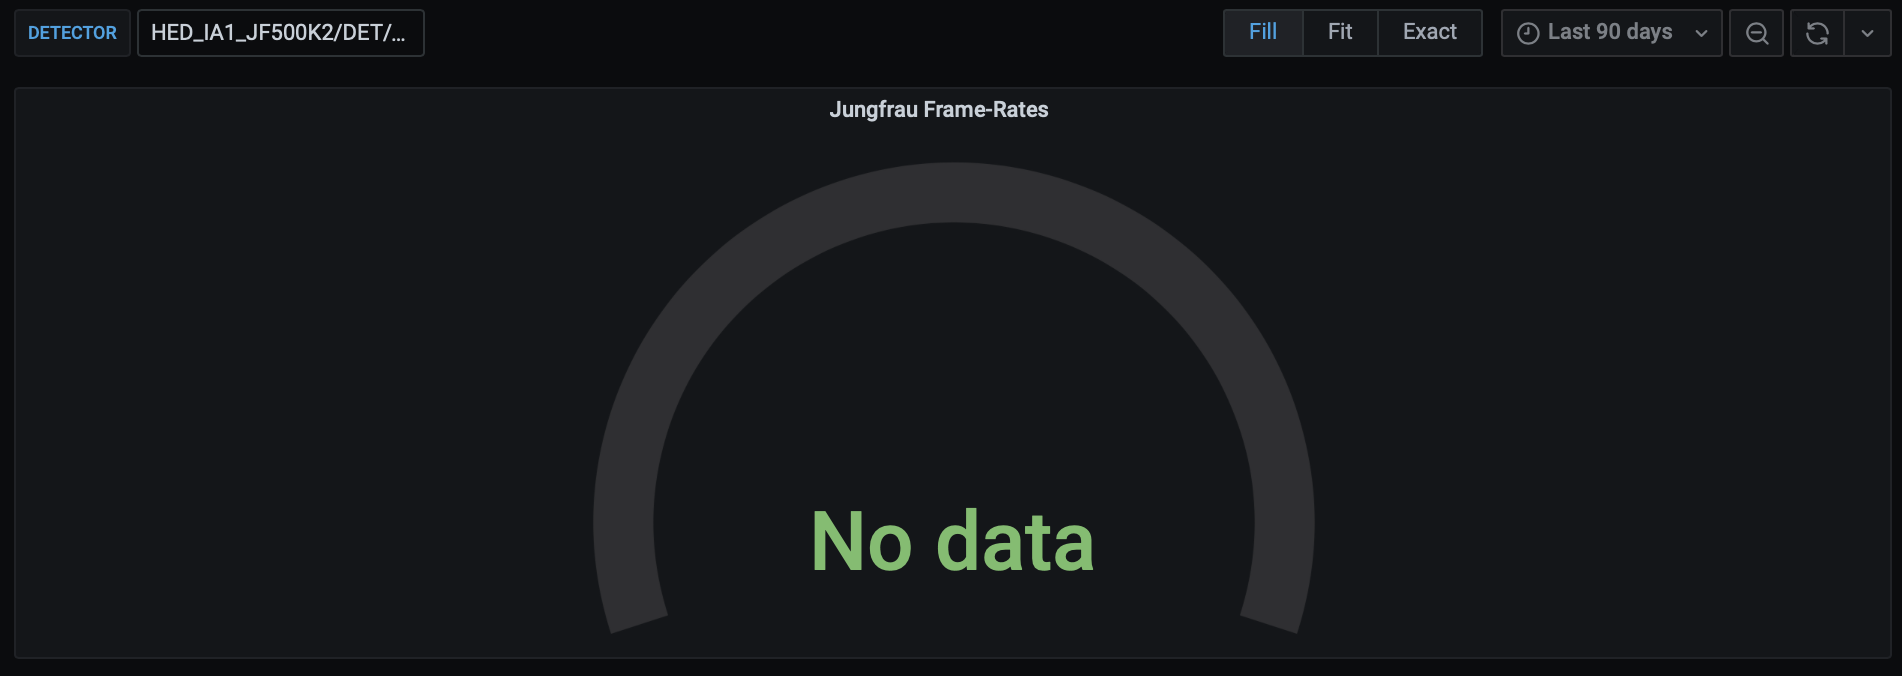
It would thus be much better to restrict the input the user can give for the $DETECTOR variable to meaningful values only.
We do this by using the Custom variable type, which allows us to define a fixed set of options.
Since the only part of the same that changes is the numerical index, we shorthand the options to the numbers 1-4:
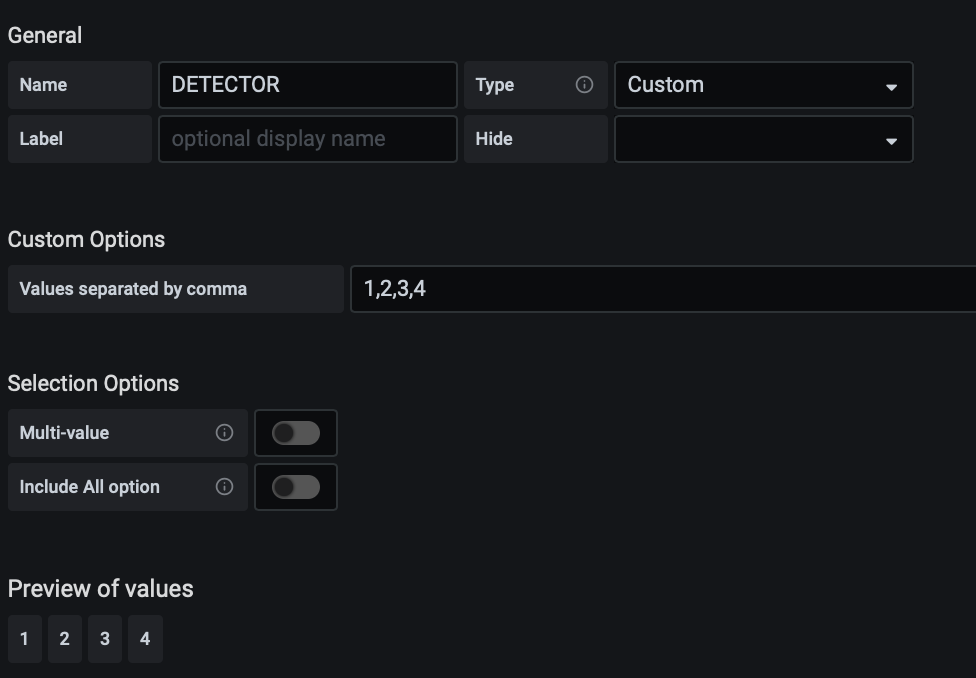
Note how we get a preview of the selectable options as the bottom of the dialog.
Since the variable $DETECTOR now only contains the numerical index and not the full measurement name anymore we have to slightly adapt out query:
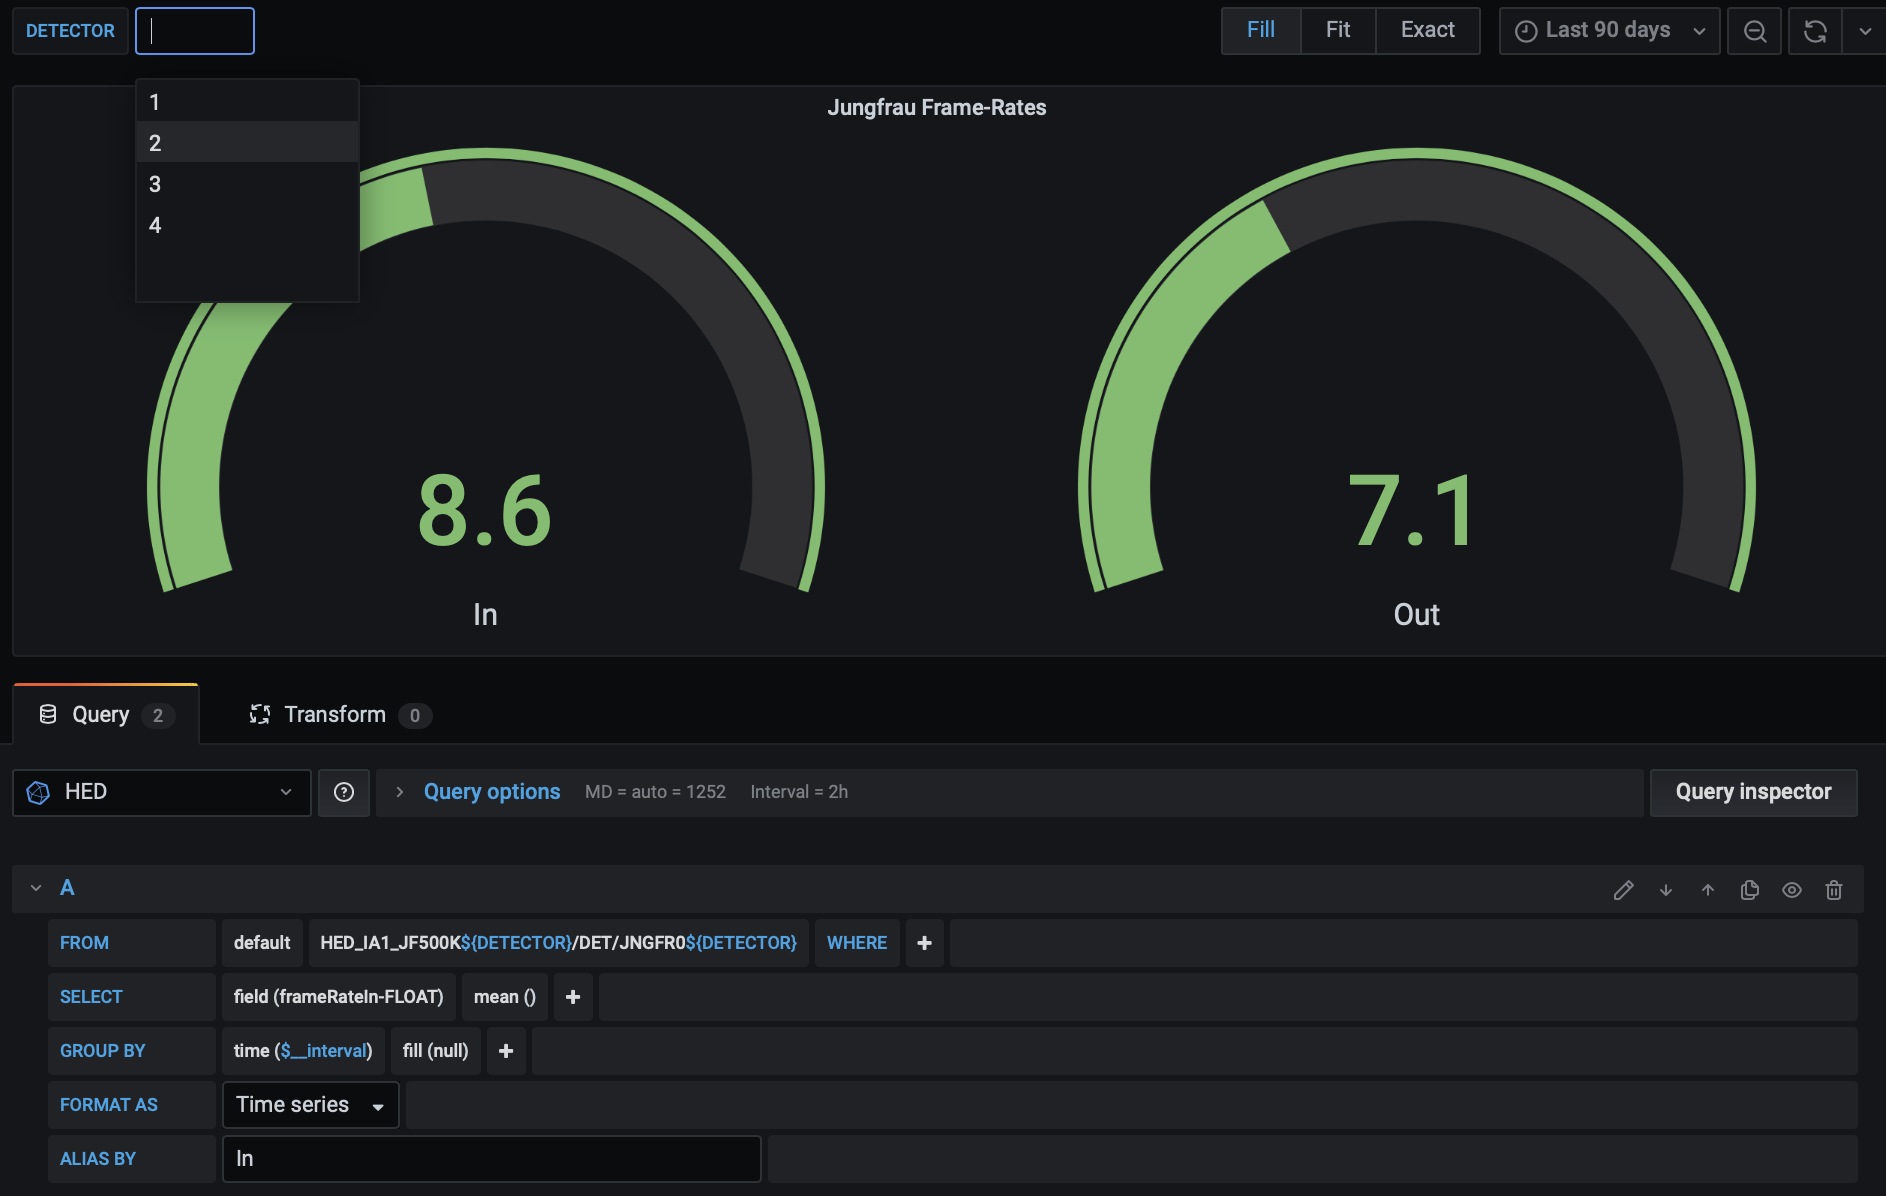
The measurement field in the query now inserts the index at the correct locations: HED_IA1_JF500K${DETECTOR}/DET/JNGFR0${DETECTOR}. Note the ${VAR} syntax to refer to variables within static text.
While this approach is already much better in that it allows to select only values for the $DETECTOR variable which resolve to data in the database, it still has a few shortcomings: we will need to update our variable definition whenever a Jungfrau detector at HED is removed or added; furthermore, we cannot simply copy the panel to other instruments. Their naming structure will not match the HED names. The panel will also break if a Jungfrau detector is ever introduced at HED that does not strictly follow the HED_IA1_JF500K${DETECTOR}/DET/JNGFR0${DETECTOR} template we used, e.g. if it is located in IA2 instead of IA1.
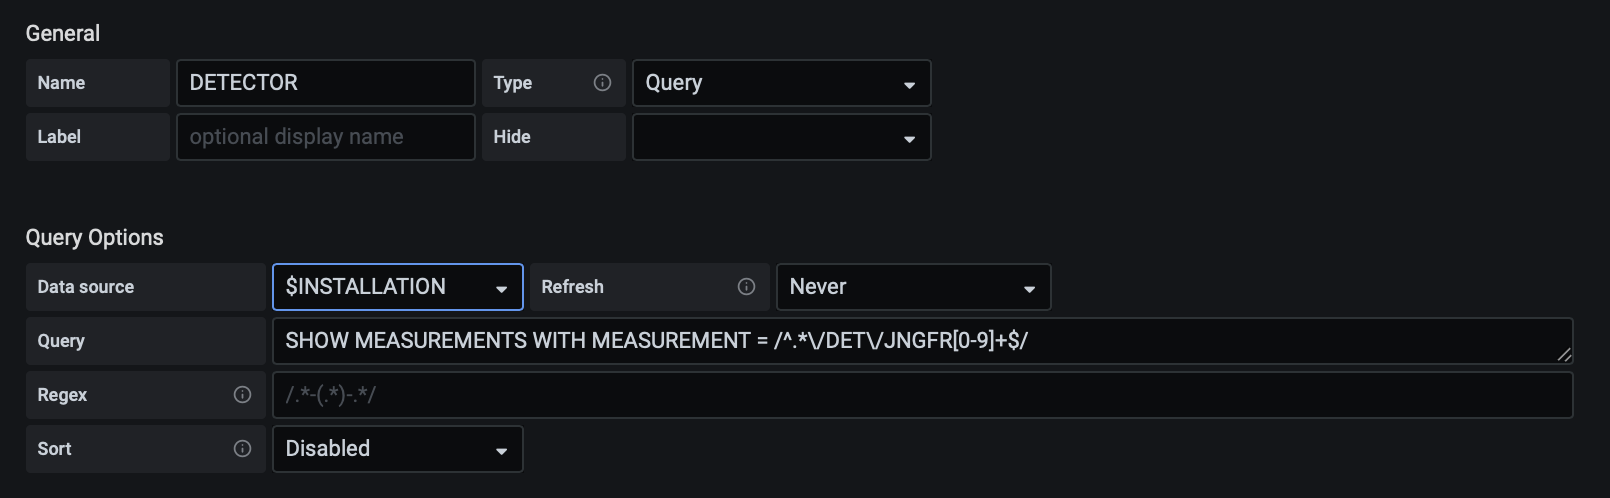
Much better would be if we could create a variable which takes its options from the database itself, rather than us statically defining these. This we can do using the Query variable type:
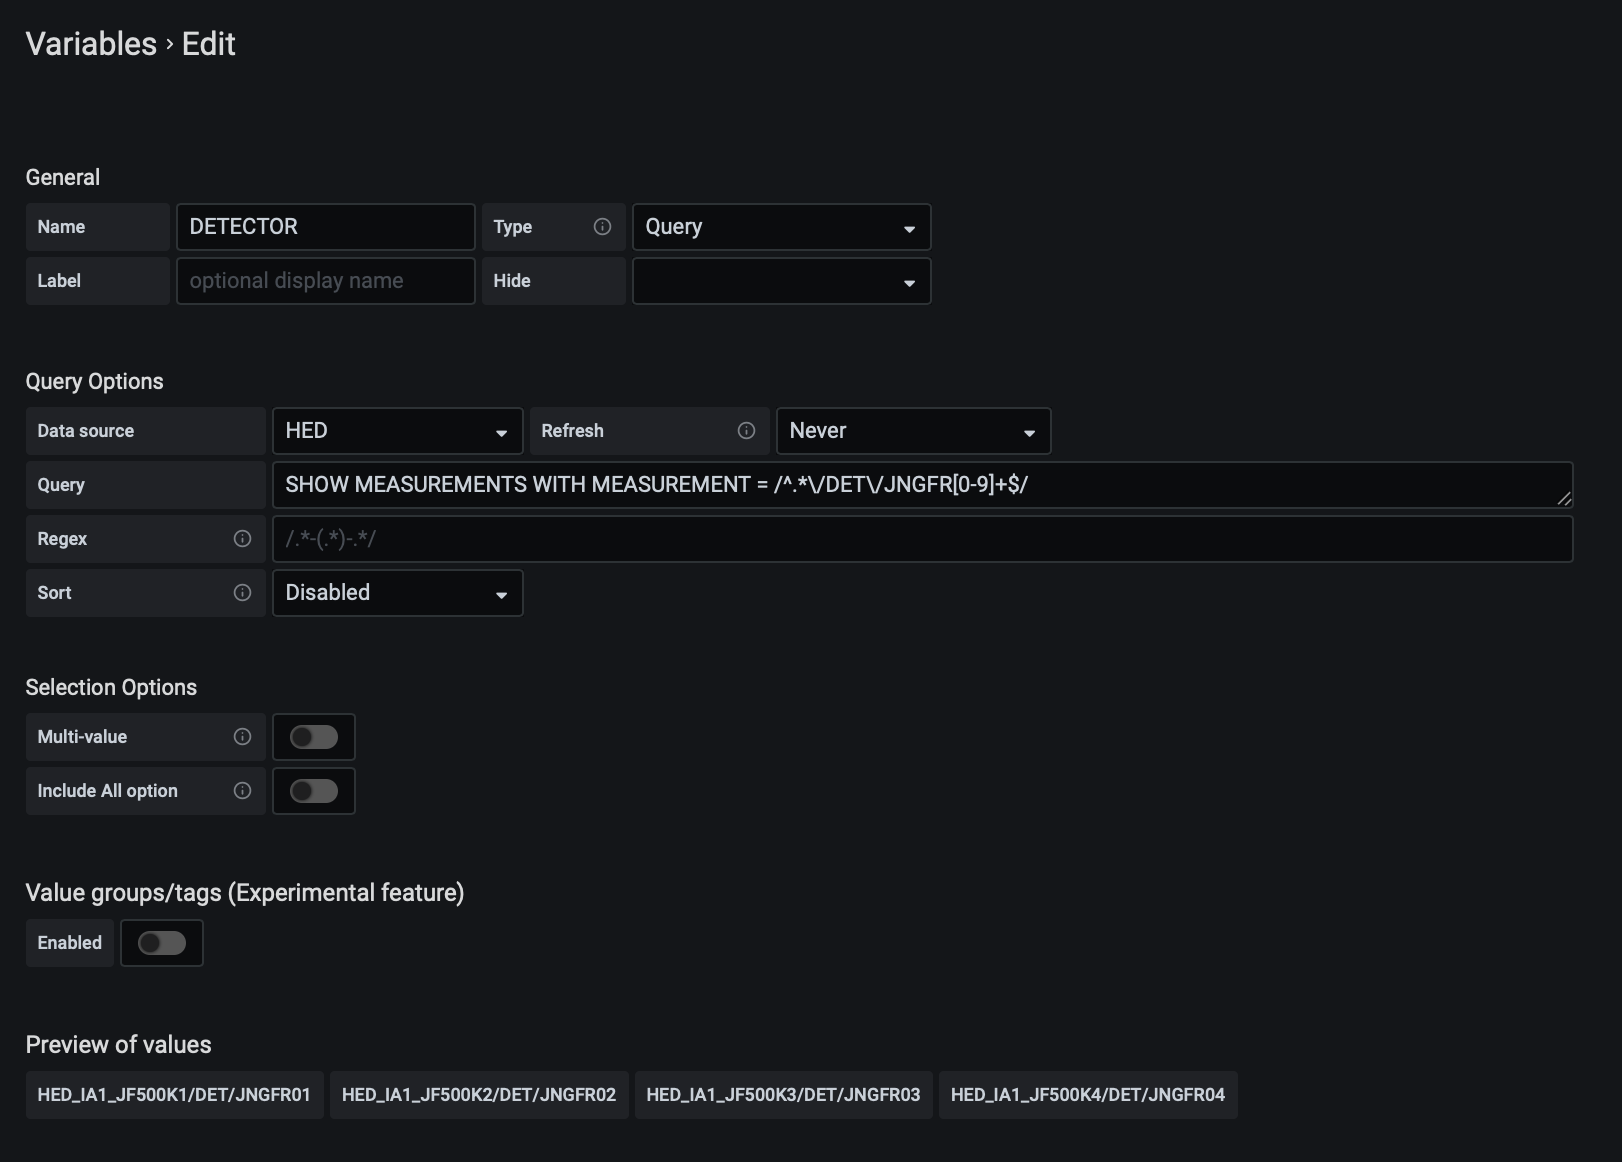
Here we define a query on the HED database that lists us all MEASUREMENTS, i.e. device ids that match a specific regular expression: SHOW MEASUREMENTS WITH MEASUREMENT = /^.*/DET/JNGFR[0-9]+$/.
Let’s first look at the general InfluxQL syntax for listing measurements in a database. SHOW MEASUREMENTS will list all measurements. However, we know that the device ids and thus measurement names of Jungfrau detectors follow a certain pattern: they will be of class DET and thus contain /DET/ in their name, alongside the JNGFR identifier. We can thus qualify the measurements we are interested in using the WITH statement coupled with a regular expression that defines our naming contraints: SHOW MEASUREMENTS WITH MEASUREMENT = /^.*/DET/JNGFR[0-9]+$/.
Let’s have a closer look at the regular expression. In Influx (and Grafana) regular expressions are enclosed in slashes (/). The expression then defines the start of a string to be part of the name (^). While not strictly needed here, this is good practice to indicate, alonside the end of the string ($). We then allow any number of characters to match up to the /DET/ part, for which we neeed to escape the slashes (/) as they are to be interpreted literally in the expression. We then fix that /DET/ needs to be followed immediately by JNGFR, which in turn is followed by digits ([0-9]) of which there needs to be at least one (+). Afterwards we do not allow additional characters - the device id needs to end after a digit ($).
Note
More details on the SHOW MEASUREMENTS can be found here: https://docs.influxdata.com/influxdb/v1.8/query_language/explore-schema/#show-measurements. A good overview of regular expression syntax is available on the Python documentation: https://docs.python.org/3/library/re.html.
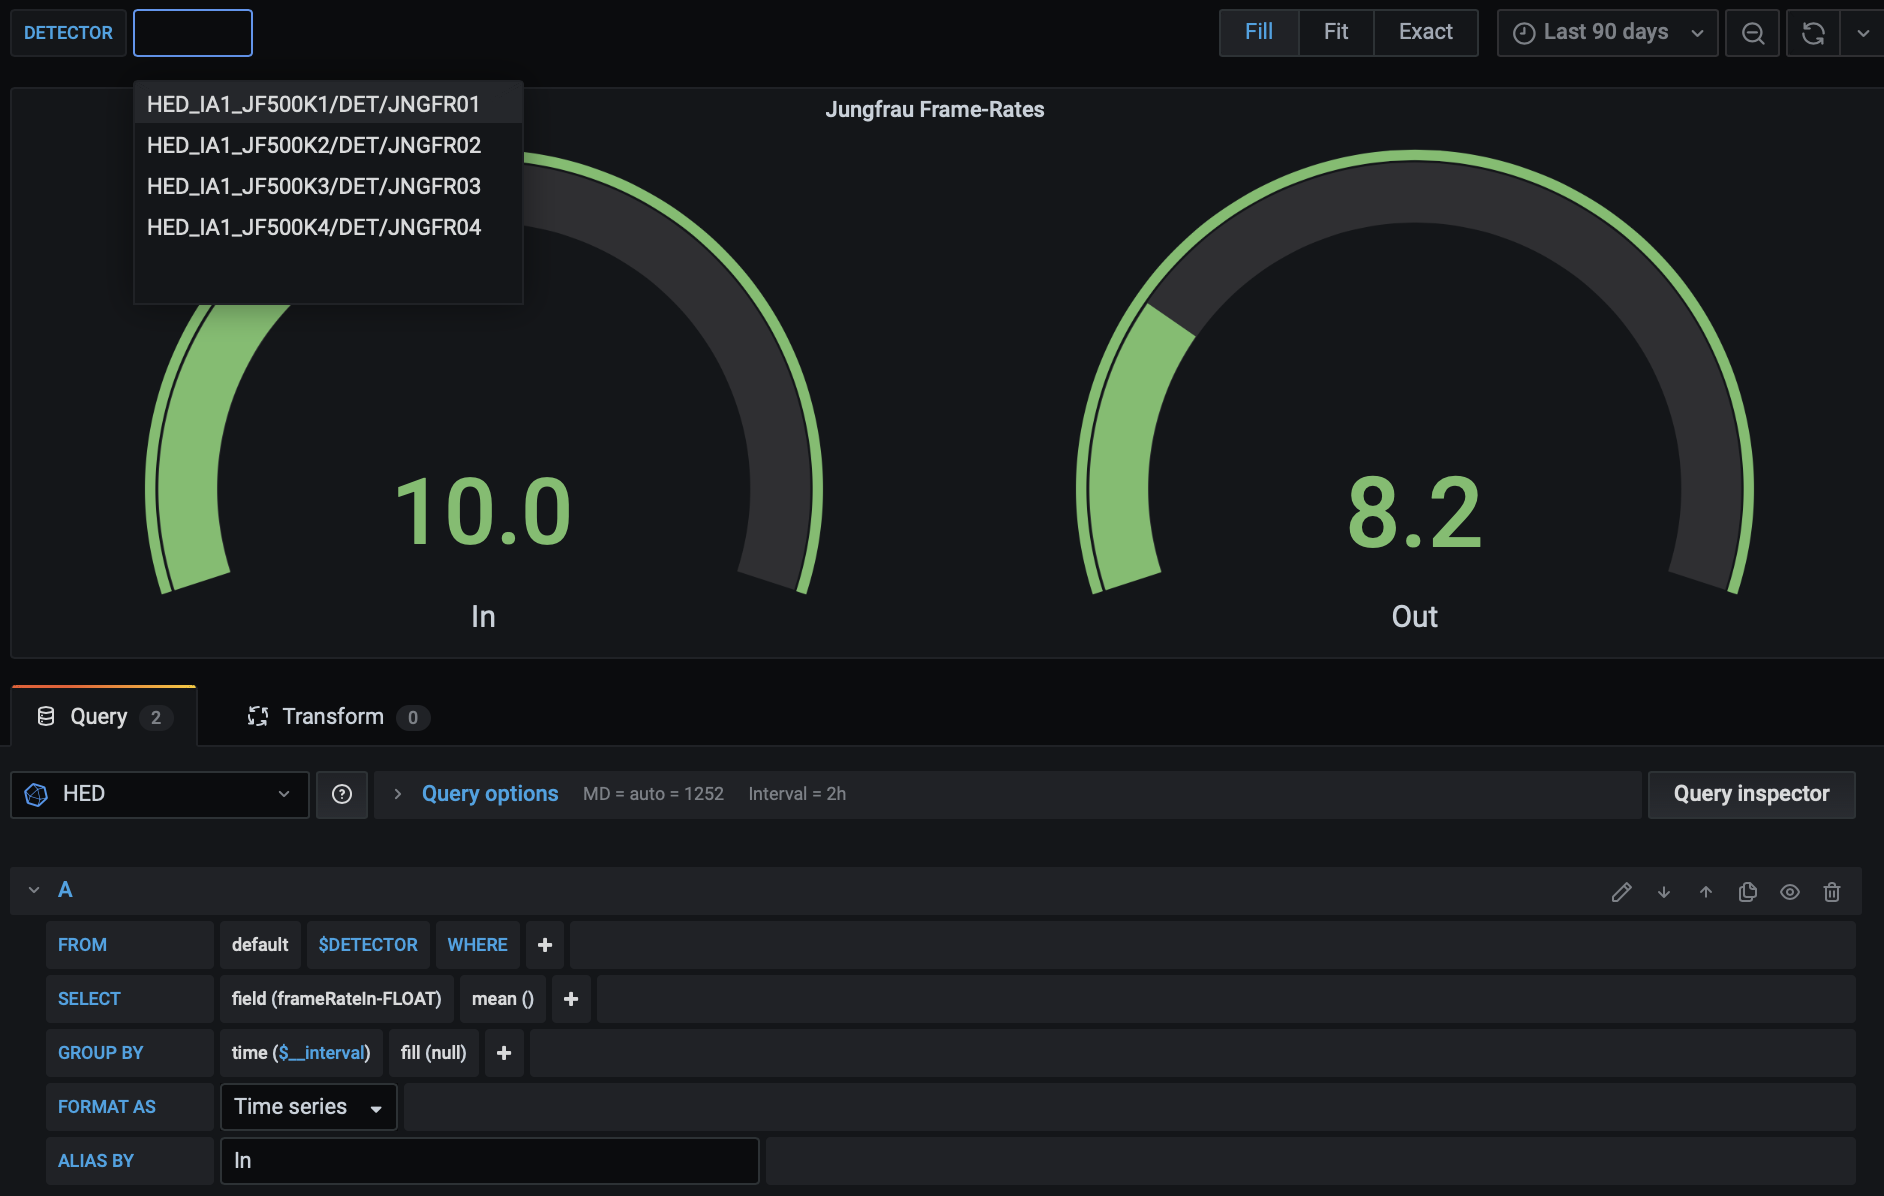
With the above changes the $DETECTOR variable will now contain the full measurement name again and will have options selectable which match the regular expression ^.*/DET/JNGFR[0-9]+$. If we add or remove a detector at HED these options will automatically update and be correct as long as the detector name minimally contains /DET/JNGFR followed by digits only at the end.
We adapt the query accordingly, as we can now use the $DETECTOR variable directly again:
We’ve now solved the problem of automatically updating the variable if Jungfrau detectors are added or removed in the HED topic. However, we still cannot easily copy our dashboard into a different instrument. Both in the query defining the options for the $DETECTOR variable and the queries populating our panel with data the HED topic is hard-coded.
To make our dashboards and panels reusable in other topics we now define a **Datasource*+ variable alongside the $DETECTOR variable. We name it INSTALLATION:
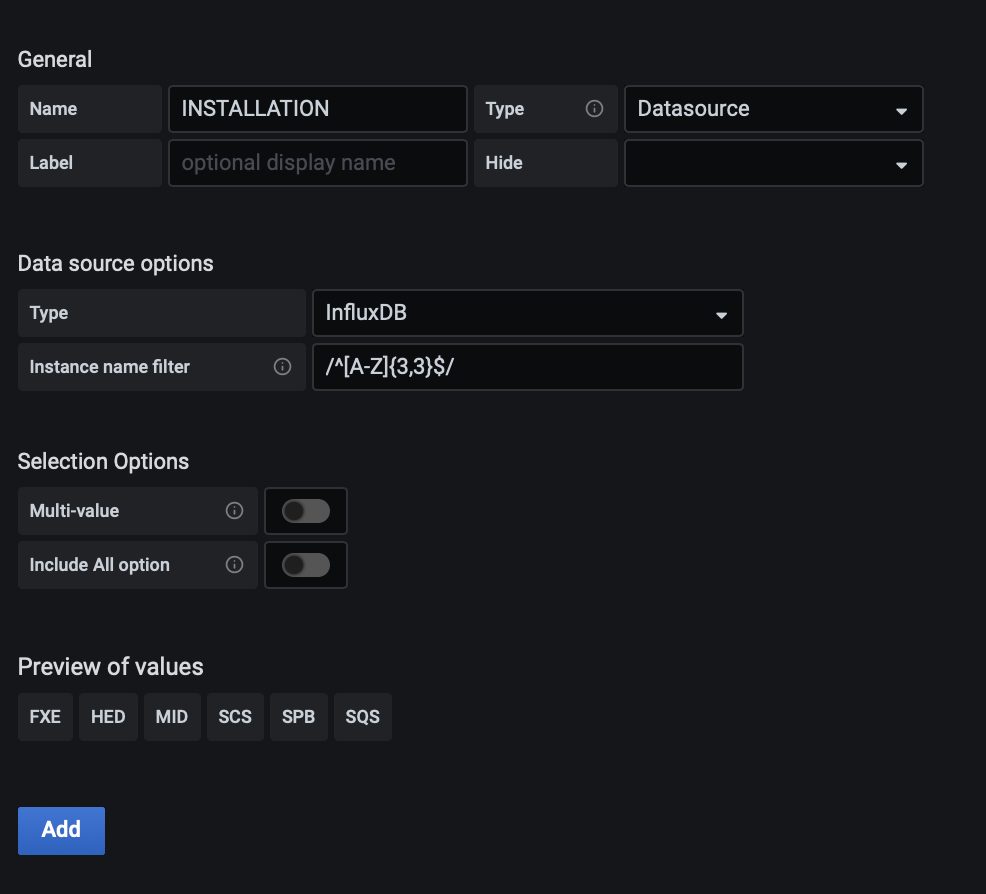
Here we have selected the Datasource type, and then defined the source type as InfluxDB. We’ve further used a regular expression to limit the options to the instrument topics. For this we assume the an instrument topic name will consist of exactly three capitalized alphabetical characters: /^[A-Z]{3,3}$/, indicated by the {3,3} restriction, which is {minumum length, maximum length}. There should be no characters before or after these three letters, hence the ^ and $ tokens at the beginning and the end of the regular expression.
Conveniently we can use the $INSTALLATION variable directly in the definition of the query determining the options of the $DETECTOR variable:
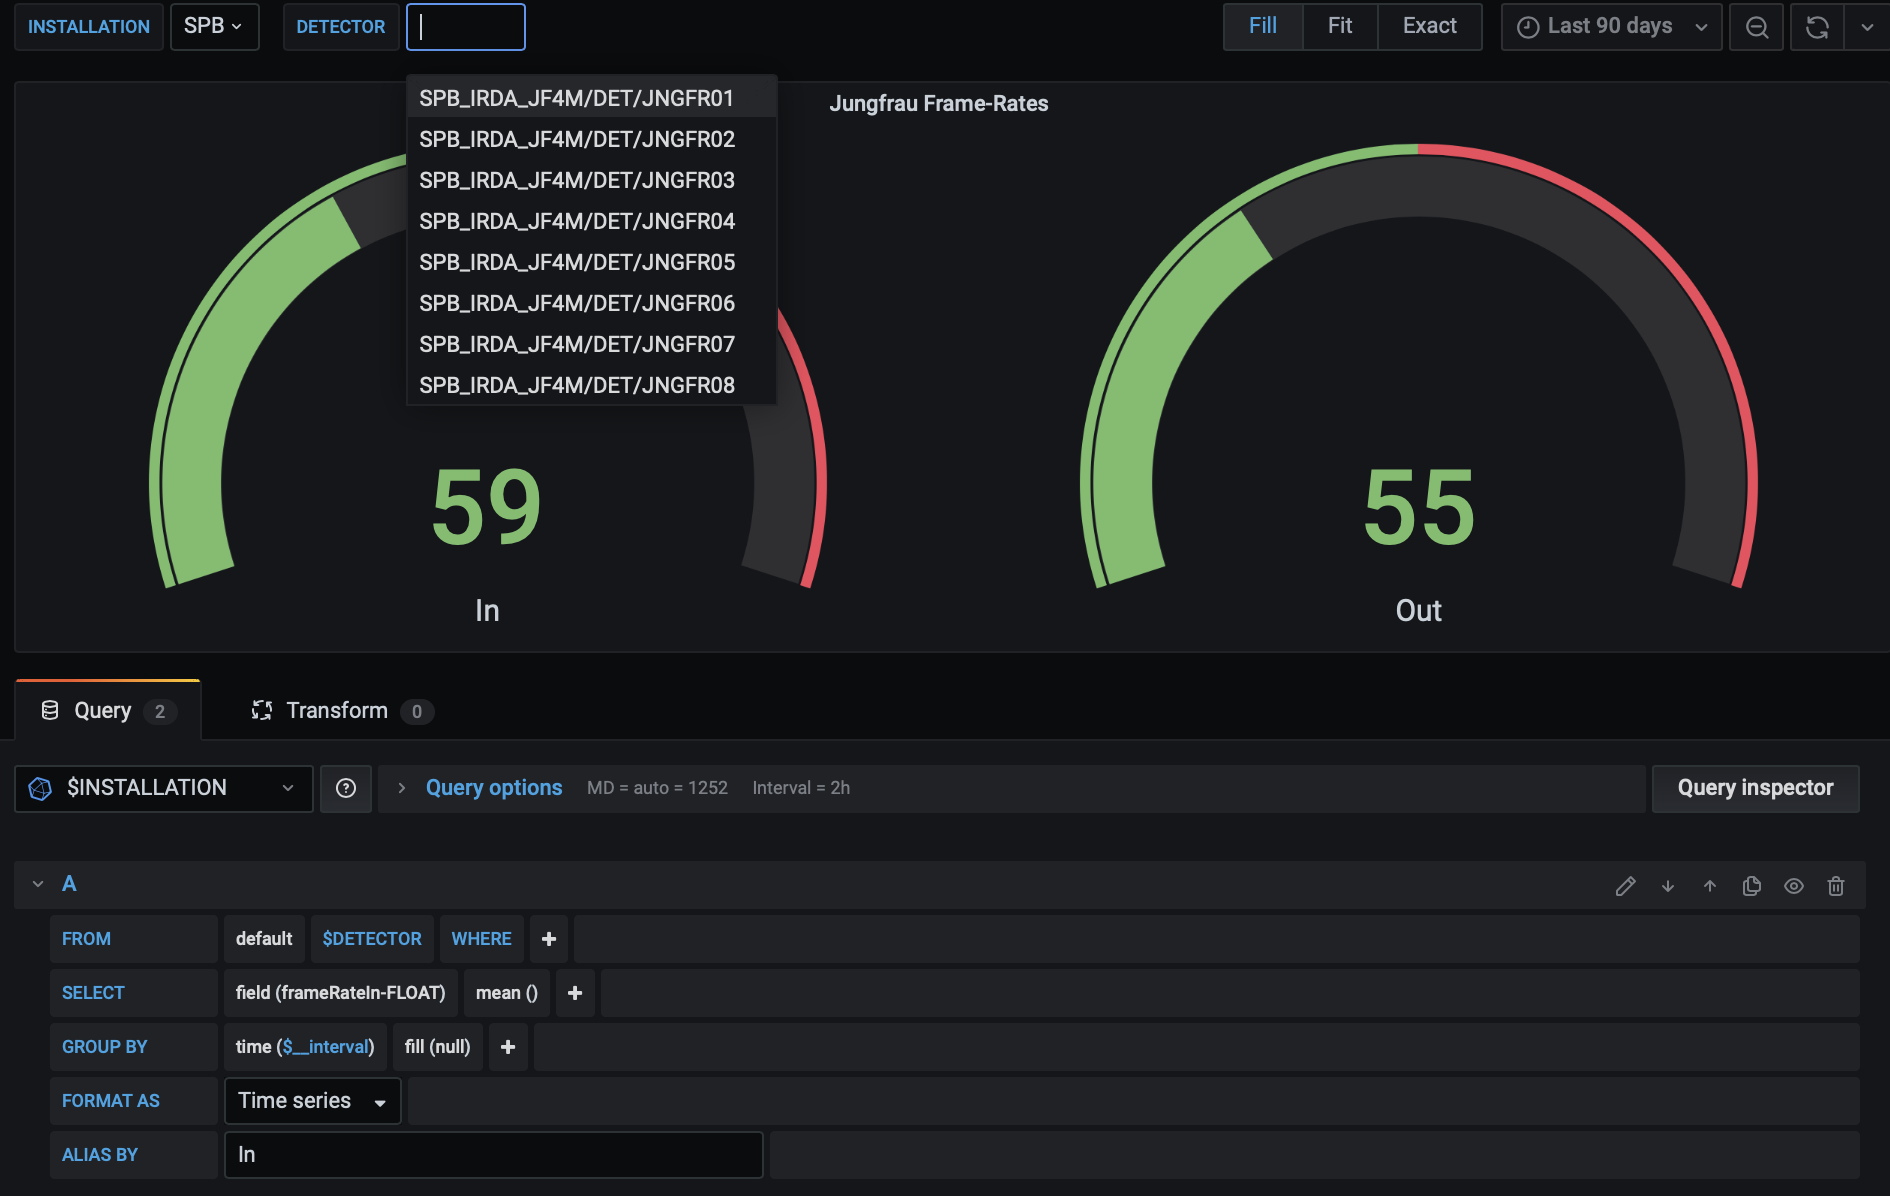
All that is left is to also make use of the variable in our panel queries. We can now select any of the instruments as INSTALLATION and any of their Jungfrau detectors as DETECTOR to be shown in our panel: