Starting the AGIPD Detector at MID
This is a guideline on how to start up the AGIPD detector at MID.
Prerequisites/First steps
Prerequisite for powering the detector is sufficiently low temperature of the detector head and electronics in the wings and therefore low pressure in the detector vessel. In order to preview and record the data the DAQ and calibration pipeline have to be in working state. In the following subsections the prerequisites for starting AGIPD and monitoring/recording data are described in more detail and what to do if they are not met (yet).
Karabo GUI
Karabo GUI should be running. If this is not the case start the Karabo GUI by opening a terminal and typing
$ ./karabo-gui
Then click on the connect button and login as admin.
AGIPD project in Karabo
The AGIPD project should be opened in the GUI. If that is not the case, load the project by clicking on the second icon from the left in the project panel (lower left of the GUI window). In the MID domain select the Agipd-master project and open it.
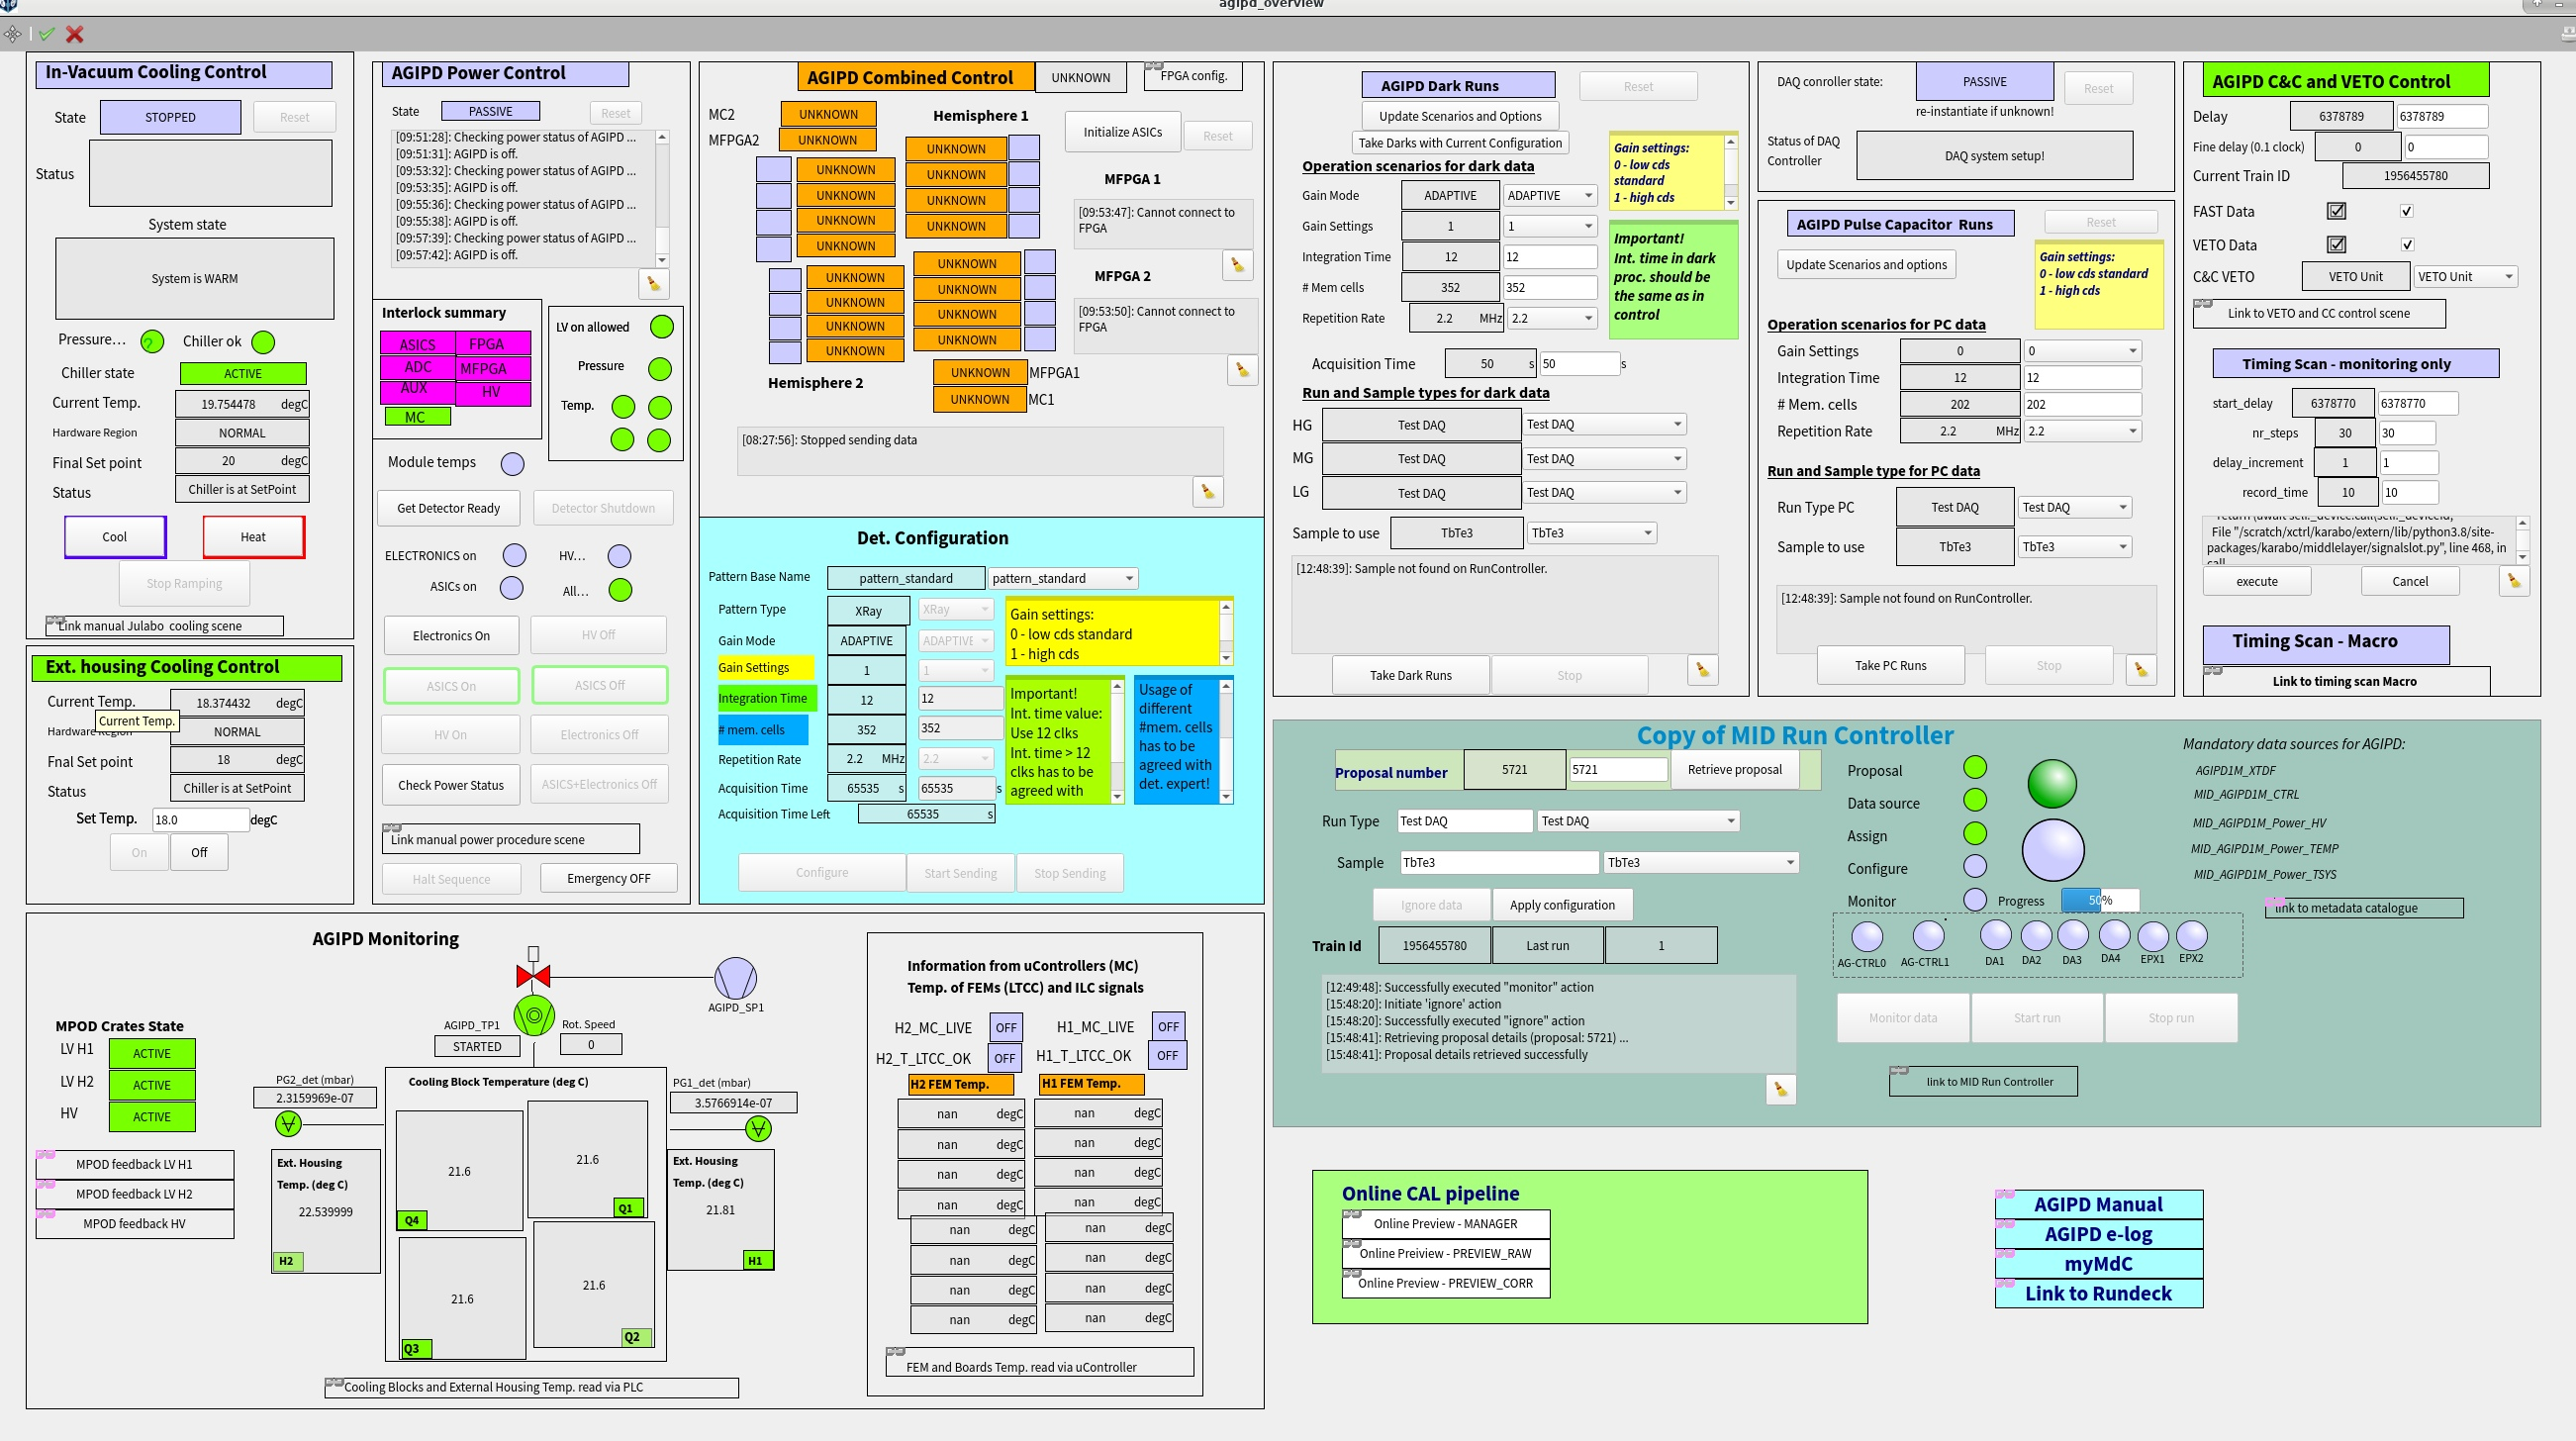
The main scene that you will need is the agipd_overview scene in the project Agipd_master, which can be seen in figoverview.
The agipd_overview scene includes subscenes for control as well as for monitoring. In later subsections there will be more information on how to use these. For normal user operation the main control scenes are:
- AGIPD Cooling Control: automatic cooling procedure for in-vacuum cooling and monitoring of the chiller status
- AGIPD Power Control: automatic power procedures and monitoring of the interlock status for the power and is described in more detail in the section Automatic power procedure
- AGIPD Combined Control for configuration of the detector for data taking and feedback from the MFPGAs. It also shows the status of the data aggregators for the DAQ.
- AGIPD Dark Runs: automatic procedure to take a full set of dark data.
- Ext. housing control: where the status of the Huber chiller for cooling of AGIPDs wings is displayed.
- Agipd Monitoring, where the temperature and vacuum status is monitored, as well as the status of the mpod devices.
- Copy of MID Run Controller with the main components from the run controller that are needed for data taking
- Subscene on the lower right corner where one can find links to the online preview scenes for the raw and corrected preview.
Note
Currently the vacuum system is not yet completely integrated in Karabo, therefore the devices for the valves are displayed in red as disabled even though they are running. The pressures gauges, however, are read out via Karabo and their indicators should be green. Usually they show a pressure in the \(10^{-6}\) mbar range. The Status of the Turbopump is displayed (and the icon should be green) but the speed will be displayed as zero, even if the pump is running.
Additionally there are scenes for C&C, Timing scans and for Pulse Capacitor data:
- AGIPD C&C and Veto Control: for configuration of the Clock and Control and Veto settings, contains also a link to the Clock and Control Scene
- Timing Scan: automated procedure to take a run, during which the trigger delay is changed.
- Pulsed Capacitor: automated procedure to take a set of Pulsed capacitor data for a set of parameters.
Usually the configurations that are tested and controlled with these scenes are set before user operation, unless given other information just check that the Trigger delay in the clock and control configuration subscene is set according to the latest version of Fig. 4, that will be hanging in the hutch.
AGIPD Combined Control scene
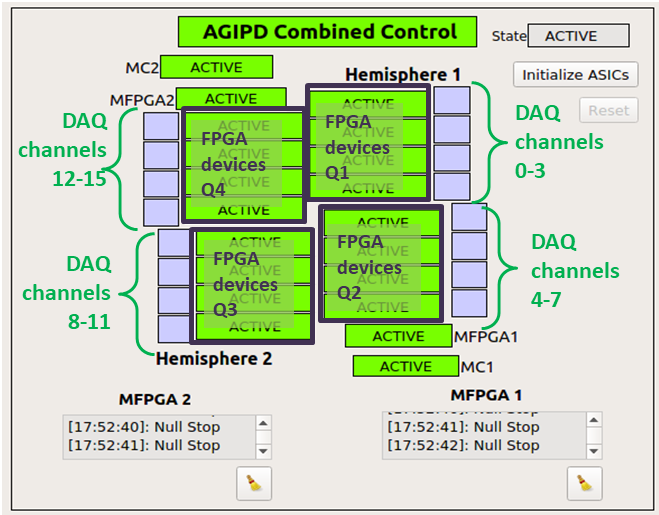
This scene displays the status of the MC, MFPGAs and FPGAs of the detector see (Fig. 6) and is the interface to configure this detector. How to configure is described in the section Configure the Detector and check the modules.
AGIPD power Control scene
This scene is used to power the detector with the automatic power procedure (as described in Section automatic Power procedure).
In addition the scene provides information about the power and interlock status of the detector:
- Under the log window, you can find information about the Interlock state and about the conditions necessary to power up.
- The Indicators for ELECTRONICS on, HV on and ASICs on show, whether the correscponding parts are actually switched on (with ELECTRONICS on containing MC,ADC,AUX,FPGA and MFPGA).
If each mpod channel is either Interlocked or off the indicator All off will be green.
Pressing Check Power Status will prompt the procedure to check which mpod channels are powered and display the corresponding power status in the log window. Note that the Message Only ELECTRONICS on is also displayed if the Asics are on as well, please check the indicators that are updated when the check is performed.
Note
Checking the power status can result in an error state of the Power procedure if there is a short time failure of the communication between the mpod feedback and Karabo. As first step one should try to reset the error and recheck the power status before starting to troubleshoot.
This scene also provides a link to manual power procedure scene (for the manual power procedure check the section manual Power procedure) and an Emergency OFF button
Note
Pressing Emergency OFF will power down all mpod channels at the same time, however the High Voltage channels will still ramp down in the normal speed of 1 V/s
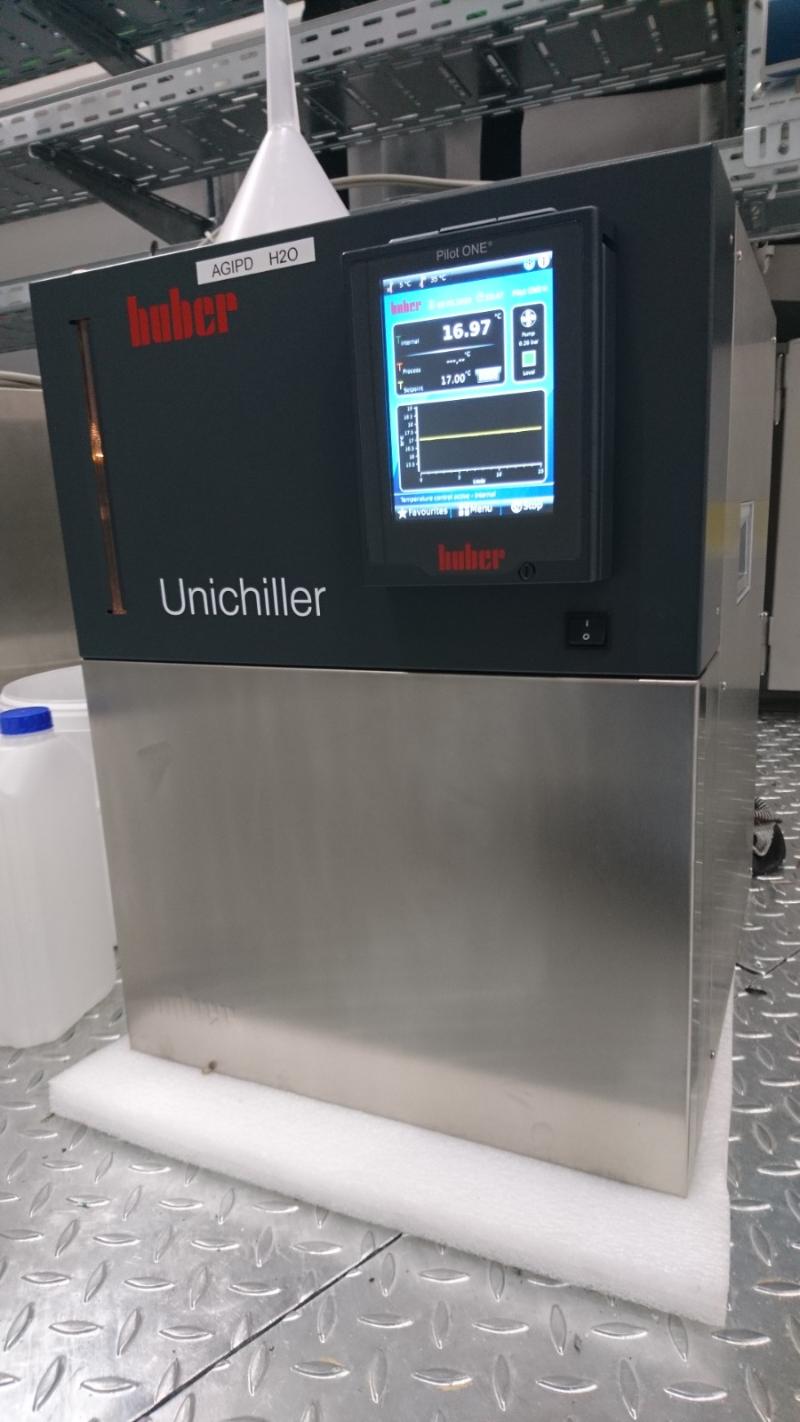
Huber Unichiller
The Huber Unichiller cools the part of the electronics of AGIPD that are located in the wings.
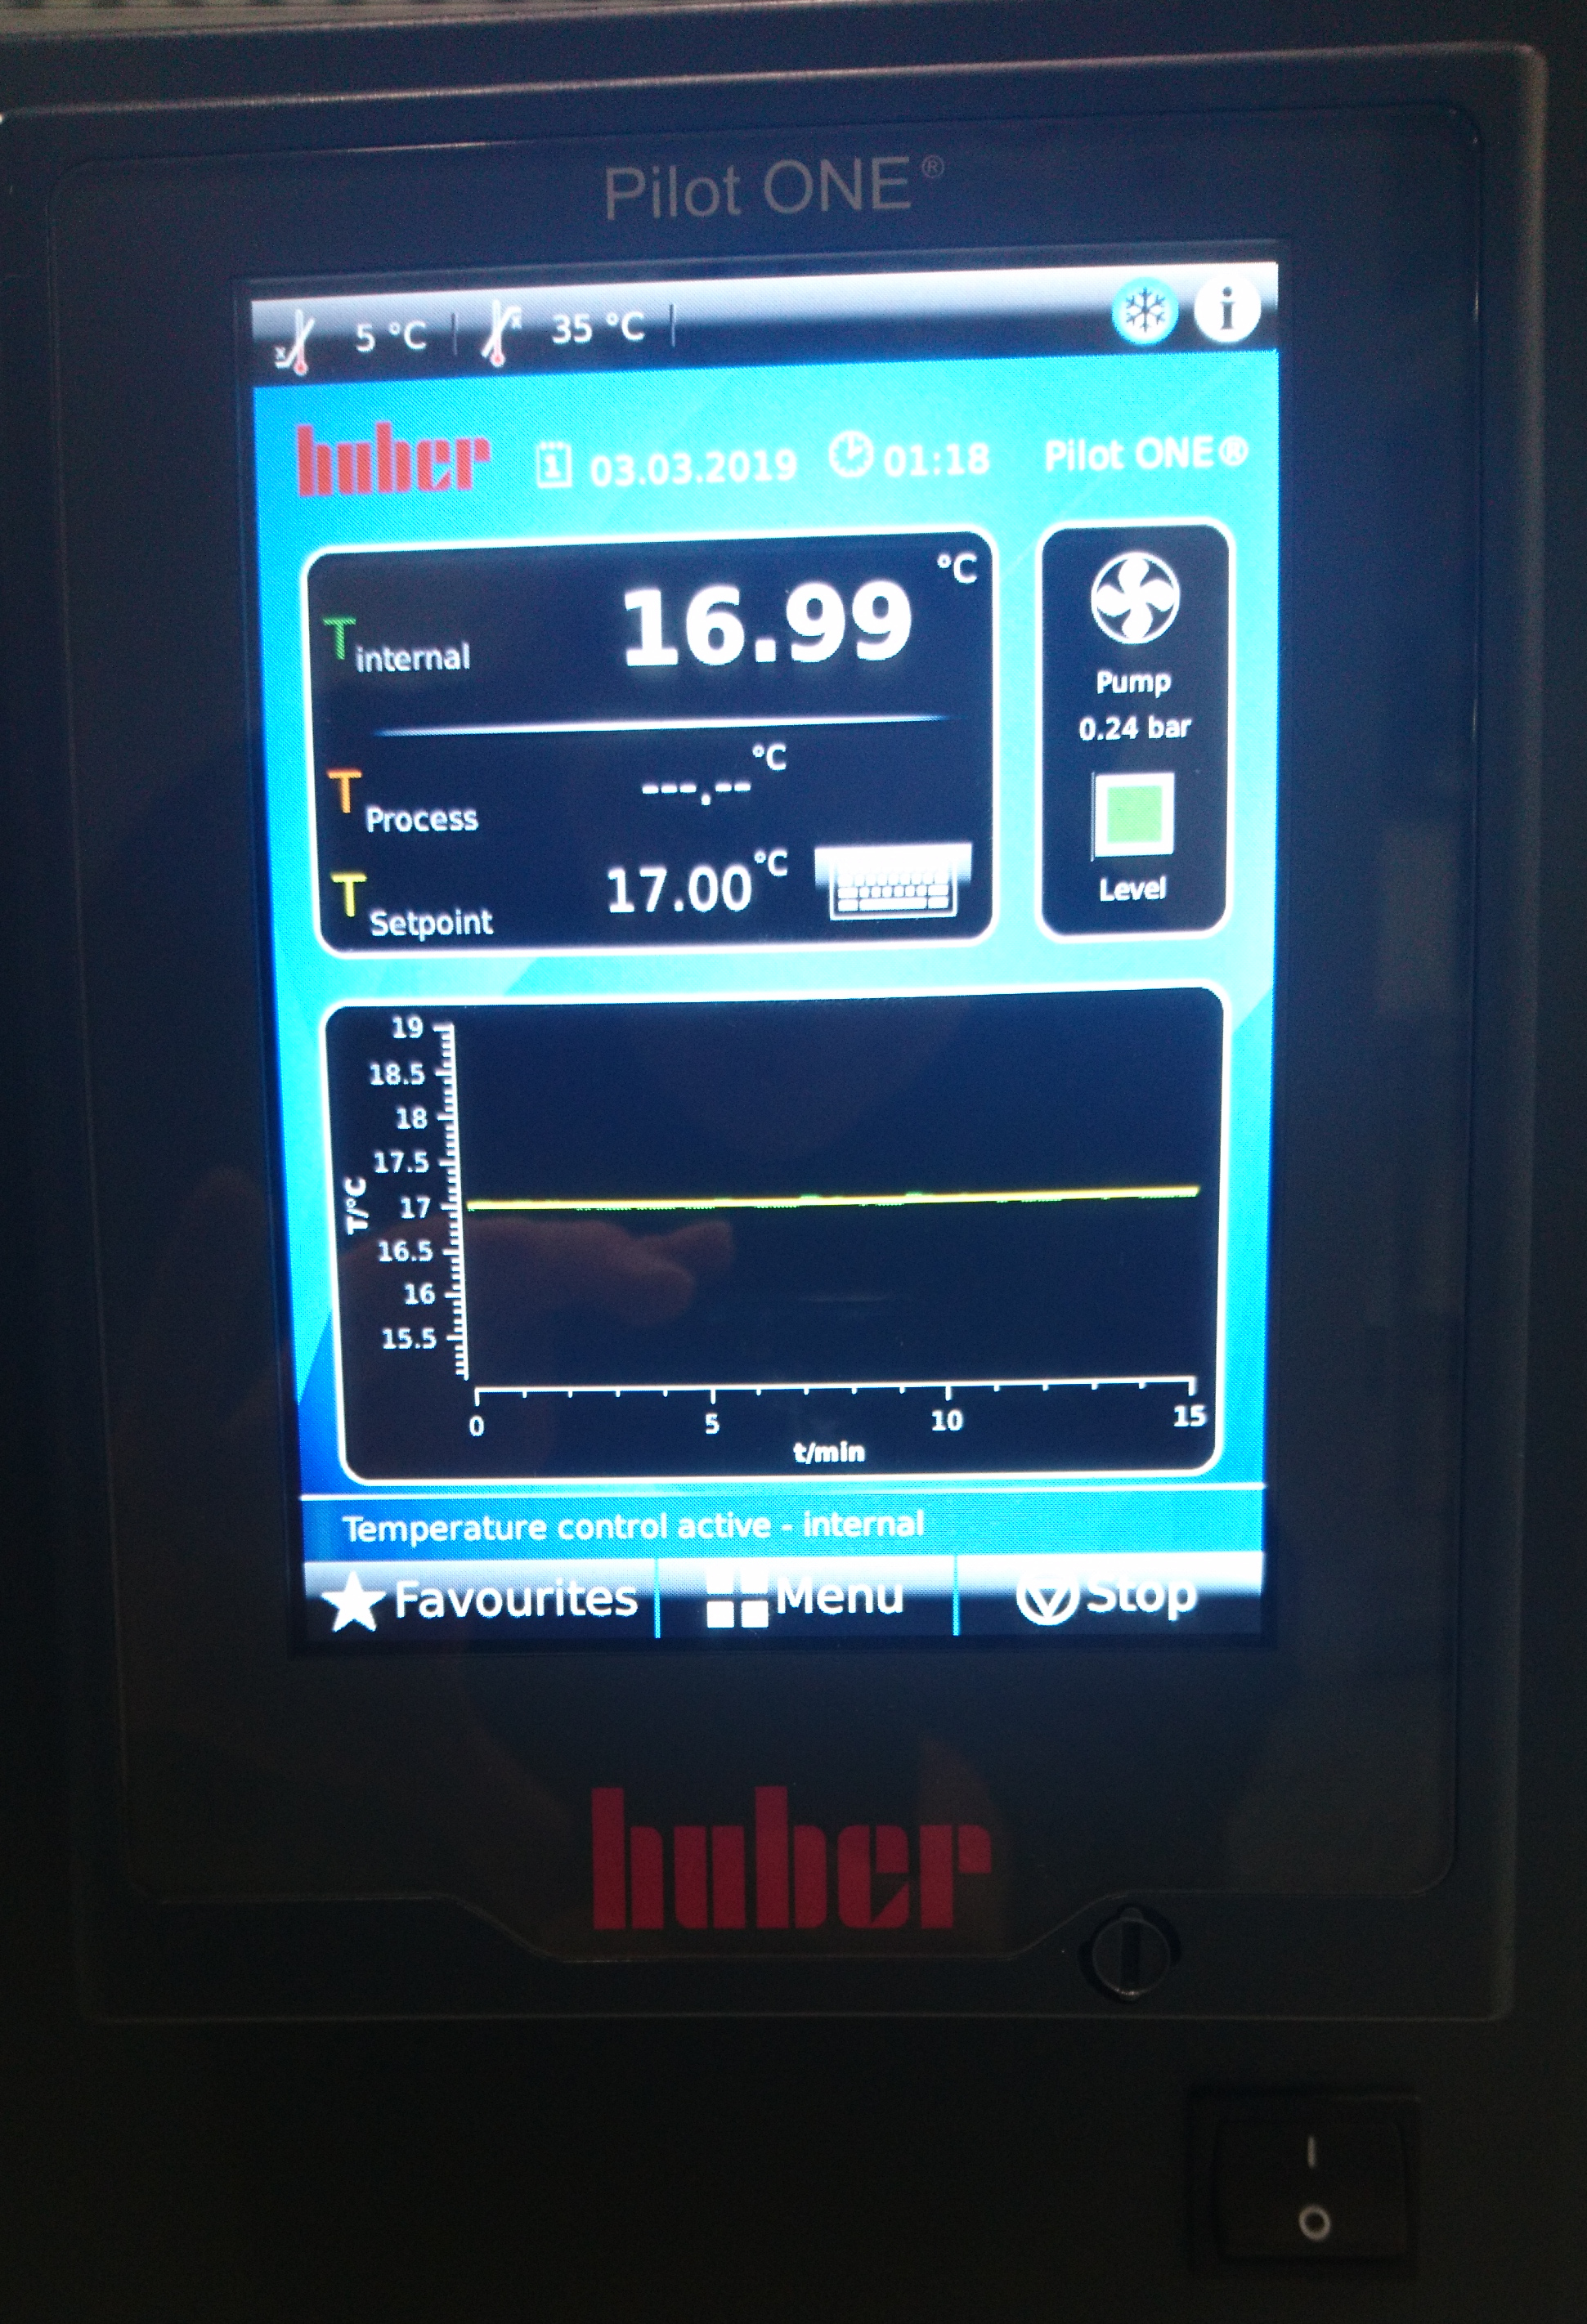
In the corresponcing subscene (see (figoverview) ) you can check, that the chiller is on, the device is active and at the current temperature.
The temperature should be set to the value that is displayed in the hutch (in the updated version of Fig. 4).
The housing temperatures should not increase above 35°C, at 40°C the power for the ASICS will be interlocked.
Detector temperature
While the wings are cooled by the Huber Unichiller, the cooling blocks and FEMS are cooled by a Julabo chiller that is located above the hutch and should ideally be running continuously.
Check the detector temperatures and cooling status of the julabo chiller in the scene agipd_overview under AGIPD Cooling Control.
In the beginning of a shift usually the detector should be in the system state COLD already, in this case the Current temp. is around -32°.
Check “AGIPD Cooling Control” part in the agipd_overview scene:
- The state of the device should be active, if not press reset.
- status window below: Temperature within precision.
- System state: COLD
- The indicators for pressure in tolerable range, chiller ok and chiller state should be green.
- Current temp. is at about -32°C.
- Hardware region: NORMAL
- Final Setpoint: -32°C
- status: chiller is cooling or chiller is at SetPoint
If the detector still has to be cooled down:
- The state of the device should be active, if not press reset.
- Check that the indicators for pressure in tolerable range, chiller ok and chiller state are green. If chiller state is red the Julabo chiller is of and has to be switched on, see below.
- Press Cool
- Final Setpoint should change to -32°C.
- system_state will change to unknown (orange)
- Current temp might first increase by a one or two degree, then start to decrease
Note
The procedure might end in unknown state with the message that the ramping did not finish in time. Check that the temperature is at -32°C and reset the cooling procedure device.
If the Julabo still has to be switched on:
- go to the Rackroom above the control room (if you are DET you might need to ask a colleague from MID for direction and to let you in)
- check whether the red level indicator of the chiller is at least as high as the mark
- first switch on the main switch of the Julabo chiller
- wait a moment, then switch on the control box on top of the chiller, it will display “OFF”
- go to the control room and navigate to the chiller device
- check, whether any warnings appear. In case of warning 21 first wait, in most cases it will just disappear after a few minutes. If not try to restart again.
Note
During the cooling procedure the setpoint will be ramped down with 1°C per minute, the scene will only show the final setpoint. One can monitor the progress of the procedure by observing the Current temp which shows the bath temperature of the Julabo chiller.
- check “AGIPD Temperature and Vacuum Monitoring” subscene:
- External housing temperature should be below 35°C for both halves of the detector
- Cooling blocks temperature: should be around -25°C in case Asics ar ON and - 27 C in case Asics are OFF
- FEM(LTCC) Temperatures: should be in range of -5 to 16°C when ASIC power is ON, in case ASIC power is off it will show temperatures below -25 C. please note , that LTCC temp. can be readout only if microcontroler and vacuum boards are powered ON. It means, if LV power is OFF you do not have access to the LTCC temp. readout and ‘nans’ are displayed in the scene.
Vacuum pressure
Verify the pressure in the “AGIPD Temperature and Vacuum Monitoring” part of the agipd_overview scene. Along with temperature this part depicts the status of the vacuum components, that are relevant for the vacuum in the AGIPD vessel:
- pressure sensors at the vacuum vessel (P_FR_det and PG2_det) with the measured pressure
- (currently disabled) Turbopump attached to the Vessel (Turbo_12), with the status and rotation speed
- (currently disabled) two valves and and two pressure gauges the pre-vacuum system
Pressure P_FR_det should be in the \(10^{-6}\) mbar range. .. At \(1*10^{-3}\) mbar the interlock will be triggered, the voltages will be ramped down and the middlelayer device of the chiller will start a rapid warm up procedure. .. The turbopump should be started, the prevacuum pressure is usually below 0.1 mbar, all symbols for the vacuum components should be green. .. Indications of trouble with the vacuum system might be:
The interlock will trip at a pressure of \(1*10^{-3}\) mbar, the voltages will be ramped down and the detector will be warmed up. In case there is a vacuum problem that cannot be resolved quickly by MID one can already power down the detector and start warming up. In order to warm it up fast, go to the chiller device MID_EXP_CHL/DCTRL/CHILLER and set Chiller Temperature Setpoint to 20°.
DAQ
In the subscene Copy of MID Run Controller one can choose the proposal (according to the printout in the hutch), change run types and samples and start and stop runs. All indicators in the scene should be green (ready to take data), the big indicator corresponds to the state of the run controller, AGIPD1MCTRL/0 and AGIPD1MCTRL/1 correspond to the slow data of AGIPD. AGIPD1MCTRL/0 contains the configuration and voltages, AGIPD1MCTRL/1 contains temperatures and timing information. Make sure that these slow data sources are included, they are mandatory for data processing. If the DAQ is not monitoring yet, always press ‘apply configuration’ first, then ‘monitoring’. If symbols indicate errors (red) or errors appear when trying to apply the configuration contact ITDM (phone numbers can be found in the hutch).
Start up prodecure for the detector
The detector is powered via MPOD channels that have to be switched on in a defined order. There are the following ways to power the detector that will be described in the corresponding subsections in more detail:
- with the automatic procedure (in one step or three)
- manually, where each step has to be done by the operator. This procedure allows to power only parts of the detector if necessary and can always be used if the automatic procedure gets stuck.
Note
Currently the fully automatic procedure is recomended.
For each procedure it is recomended to monitor the status of the MPOD channels. To do this open the power supply (MPOD) feedback display for the hemispheres H1 and H2 and the high voltage HV (see Fig. 9) in a browser window:
H1: http://mid-exp-agipd1m-mcps-h1-lv.desy.de/
H2: http://mid-exp-agipd1m-mcps-h2-lv.desy.de/
HV: http://mid-exp-agipd1m-mcps-hv.desy.de/
On the gui pc there are also bookmarks to the links.
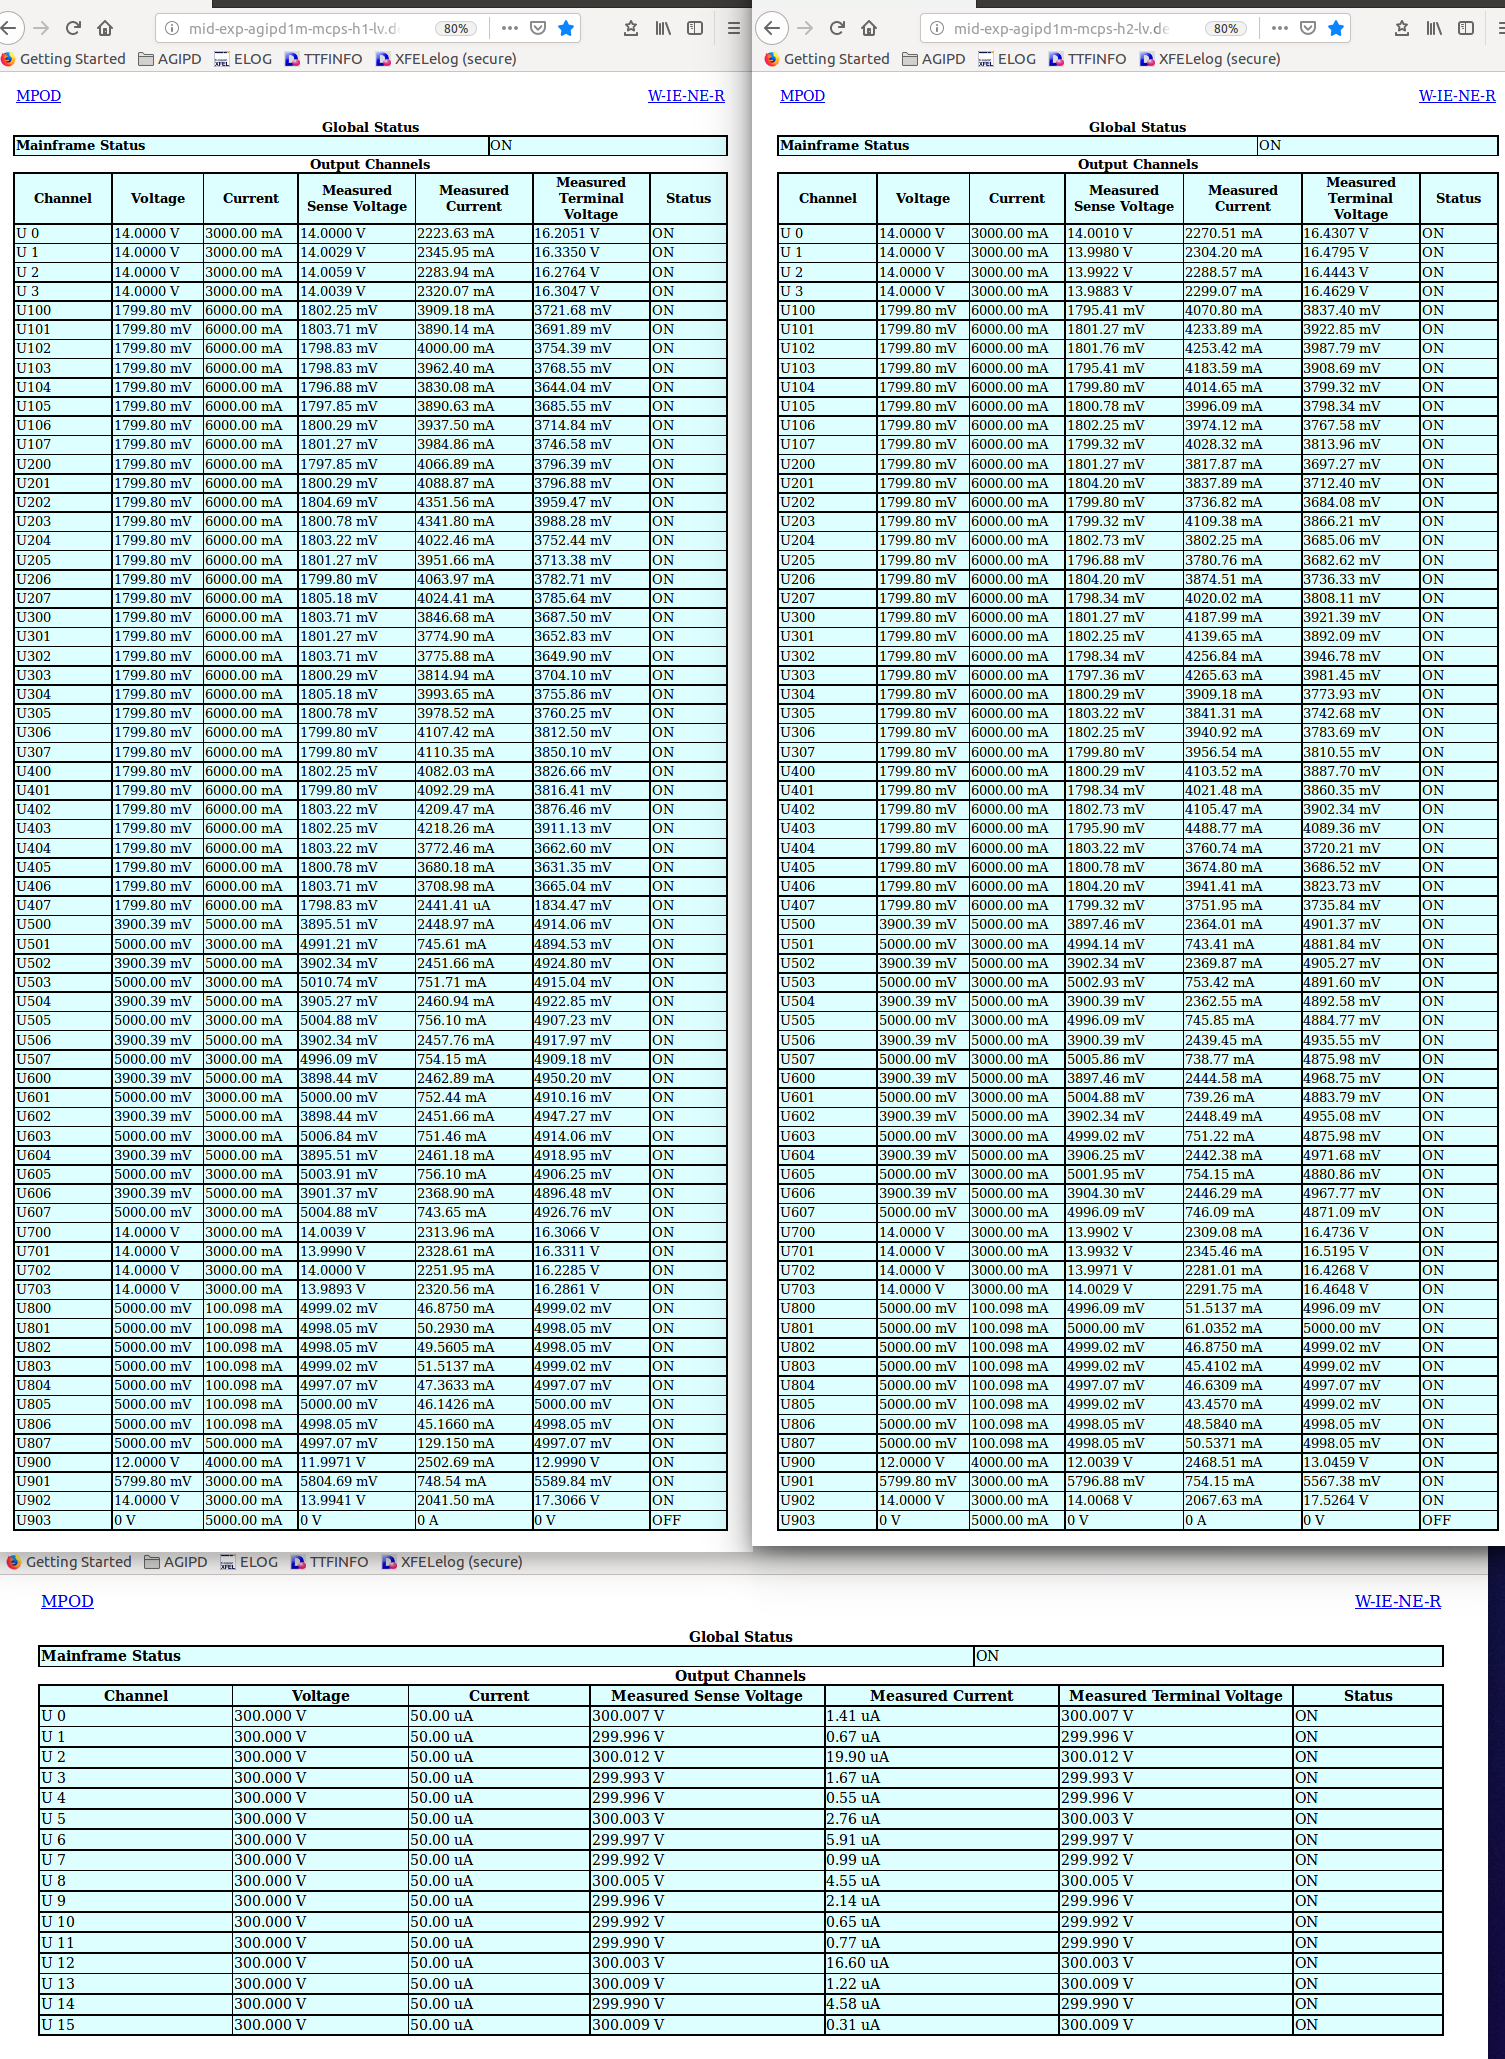
Fig. 9 The MPOD feedback displays in browser windows, the upper two windows are for the LV channels of H1 and H2 respectively, the third is for the HV channels. This screenshot is from 23.02.19. Check the Elog for the most recent screenshot!
For each procedure it is also recomended to make sure that all FPGA devices are instantiated and without error. For this check the status indicators of the devices in the subscene Agipd combined control.
Configure the Detector
The detector can already be configured once the Electronics are on.
In the subscene AGIPD combined Control the following parameters should be set:
Pattern template: pattern_standard - this is the current standard pattern
Pattern type:
- Xray: for taking Xray data
- Dark HG: used to take darks for the high gain stage, essentially the same as the Xray pattern type
- Dark MG: used to take darks, while the detector is forced to the medium gain stage
- Dark LG: used to take darks, while the detector is forced to the low gain stage
- PC: only for pulsed capacitor data (which is usually rather taken with the automatic procedure)
- CS: only for current source
- Gain Mode:
- ADAPTIVE: normal operation mode, gain will be adapted
- FIXED_HG: fixed in high gain
- FIXED_MG: fixed in medium gain
- FIXED_LG: fixed in low gain
Note
the Parameters Pattern type and Gain Mode are not independent. Fixed gain modes are to be used with Pattern type Xray. The controls will only display those options of the Gain mode, that are applicable with the current Pattern type.
Gain Settings:
- 0 for standard operation
- 1 for operation at very low intensities (0.5 photons/pixel!)
- Integration Time (in clocks):
- 12 is the standard integration time and the minimum. Integration times of more than 12 have to be agreed with the detector experts.
# Pulses: sets the number of memory cells. In theory this can be set to any value up to 352, but there are only specific values for which calibration data exists (64, 202, 352). Please check the print out in the hutch or confirm with the run coordinator
Repetition rate: should be set according to the pulse rate of the FEL, but again not for all parameters calibration data might be available.
Aquisition time: can be set up to ~ 60000s
Note
When the repetition rate of 0.5 MHz is set the detector will sent the maximum of 338 memory cells, if Mem cells are set to more than that.
- To configure the detector:
- Go to the AGIPD combined Control part of the agipd_overview scene.
- Check if the the log windows of the MFPGAs of Hemisphere 1 and 2 are updating. When the detector is not sending data they should repeat ‘Null Stop’ with a time stamp that should increase every second.
- Choose the parameters you want to apply (see description above)
- Make sure to hit enter, then click Configure Detector. In the log windows of the MFPGAs the message “loaded bunch structure file” will appear briefly before it displays “null stop” again.
- Click on the Start sending button underneath. The button should become inactive and the (m)fpga devices will display the state “Aquiring”. In the log windows of the MFPGAs (that previously said ‘Null Stop’ ) the messages ‘Running’ and ‘Stopped at [some number]’ should appear alternately.
Check in the online preview (see previous section), whether all of the modules appear and if the modules are in good shape. For comparison a picture of the current expected status (an updated version of Fig. 3) is hanging above the monitors of the gui pc. If there are more hot regions on the modules than in the printout, or there are modules missing from the preview go to the troubleshooting section.
Automatic power procedure (recommended)
Make sure the prerequisites are met (otherwise you will not have interlock clearance to power):
- the chillers are on and the temperatures of the detector wings and cooling blocks is ok
- the vacuum is in permissable range
- the mpod devices are active (the indicators are on the lower left part on the overview scene under `MPOD Crates State `)
- the fpga composite device is instantiated and not in error (unknown is ok)
- the state of the power procedurer is `active `
Then one can either power the detector up to HV in one automatic step or carry out three steps separately.
One Step procedure:
- Go to the AGIPD power Control part of the agipd_overview scene and press Get Detector ready
- if the power is displayed as ON, check that all channels (apart from 903) are powered in the browser feedback.
Procedure in three steps (this is useful in case one wants to check the preview before the High voltage is applied is on):
- press `Electronics On `, this will power the electronics including the fpgas, wait until the power procedure is active again, in the mpod browser feedback the low voltage channels apart from Channels U100 - U407 should be powered.
- when the Elecronics On indicator is green and the Power procedure us Active again press Asics on - Channels U100 - U407 are powered.
- when the Asics On indicator is green and the Power procedure is Active again press HV on - channels U0 -U15 will ramp up, this will take ~ 5 minutes, then the status is “ON”
Configure the detector, push data and monitor the online preview as described above. The dark images for normal operation should look similar to the one on the wall.
Verify if all modules of the detector are sending data and dark images for normal operation look similar to the one on the wall. If it is not the case, please check Troubleshooting section of this manual.
Take a set of dark data
Note
Clicking ‘Halt Sequence’ will stop the current procedure where it currently is, all channels that are already powered will stay on. If the procedure was stopped because it was stuck, click ‘Emergency Off’ before starting a new attempt to automatically power the detector. In case the automatic procedure keeps getting stuck, the manual procedure can be used which is described in the next section.
In principle each of the three steps can also be performed manually by performing the corresponding steps described in the following section. Before taking over after an automatic step make sure that it has actually finished, that the procedure is active again and the detector is in a defined power state. When switching back from manual powering, update the procedure to the manual changes by pressing ‘Check Power status’
Manual power procedure (not recomended, if you can use the automatic procedure instead)
This procedure can be used in case the automatic power procedure fails. Open the manual_power scene, the link can be found at the bottom of the AGIPD Power Control Check that all interlock devices are available, i.e. the indicators are either violet or green. Orange or red indicate problems on the PLC/Beckhoff level and you should contact MID.
The powering sequence
For the powering sequence the Manual Power scene is used. It is also described in bullet points in the lower part of the scene.
With the field ‘Tag filter’ of the scene one can choose which channels should be powered up. Once the tag is applied and one clicks on ‘On’ all the channels will power up, that have the corresponding tag assigned to them.
You can combine tags with “|”, this stands for ‘and’. So in case of the tag “mc|efan” channels with tag mc (microcontroller on channel 901) and with tag efan (ventilators on channel 900) will be powered on each half of the detector. When adding a tag behind a comma, you can select for that tag, for example ‘mc,h1’ will only switch on the channel 901 for the microcontroller on the wing H1, while the one on H2 will stay off. In the following the necessary tags for the power procedure are given for each step.
Power efans and microcontroller (MC). First, make sure the interlock is armed (green). If it is blue, arm the MC interlock by clicking on ‘arm’:
'MC and EFAN' interlock => arm
Then, in the right tag filter field write mc|efan (the | stands for &) and acknowledge with enter. Then click ‘On’ in ‘Switch Channels’:
Tag filter = `mc|efan` Switch channels = press On
Monitor the browser windows for the low voltage of H1 and H2, the channels 900 and 901 should power up on both.
Wait until the microcontroller fields on the right of the scene will become online showing NORMAL:
MC1,2: State='NORMAL'==> AUTOMATIC=1 for micro-Controller 1,2
Set AUTOMATIC to 1 for both MCs. A current rise in the channels U900 an U901 should be observed. Wait until both display OPMODE=3. One will take longer than the other:
MC1,2: OPMODE=3 ==> continue
Now, arm all blue interlocks (MFPGA, FPGA, ADC, AUX) by clicking on them:
'MFPGA' interlock => arm
'FPGA' interlock => arm
'ADC' interlock => arm
'AUX' interlock => arm
All interlocks except ASIC and BIAS should now be in a green state. All channels below U500 and U0 - U4 should go from state ‘interlocked’ to ‘off’.
Power the master FPGA by setting mfpga in the tag filter field and then switching it on:
Tag filter = `mfpga` Switch channels = press On
Channel U904 is powered.
Power the ADCs and AUX channels by setting ‘adc|aux’ in the tag filter field and clicking on:
Tag filter = `adc|aux` Switch channels = press On
Channels U500-U607 (adcs) and U800 - U807 (aux) are powered. The status of the voltages in the two big MPOD browser windows should be symmetric. If it is not, try repeating this step, if the problem remains, call experts.
Tell the MCs that the AUX channels are on, by setting the two fields to 1. Now wait until OPMODE=7 on both MCs:
AUX=1 for micro-Controller 1,2
MC1,2: OPMODE=7 ==> continue
Switch the FPGAs on by setting ‘fpga’ in tag filter and clicking on. Wait 1 minute until ADCs have been tuned. During the waiting time you can continue with steps 8 and 9 though:
Tag filter = `fpga` Switch channels = press On
Channels U700-U703 and U0 - U4 are powered.
Configure the detector
Arm the ASIC interlock, so it is in the green state and the state in the browser goes to ‘off’ for channels U100 - U407:
'ASIC' interlock => arm
Power the ASICs by setting the tag filter to asic and clicking on:
Tag filter = `asic` Switch channels = press On
Channels U100 - U407 are powered. If it is not symmetric (see above), redo. Push data immediately by pressing ‘send data’ and check the online preview as described above. If everything looks ok, you can directly proceed to the next step.
Arm the HV interlock so that it is green. In addition, clear the interlocks by clicking on the button:
'BIAS' interlock => arm
clear interlock
Power the HV , by changing the tag filter to bias and clicking on ‘on’.
Tag filter = bias Switch channels = press On
Wait for the channels to fully ramp up and change to status ‘ON’ before proceeding to take data
Dark data
At the start of the shift as well as when the detector had to be powercycled a set of dark frames should be recorded. Confirm with the MID staff that the detector is in the dark (eg shutter is closed or there is no beam).
One can take a set of dark data either manually or with the automatic procedure. The automatic procedure is recommended, unless there are any issues (for example, when it gets stuck repeatedly) In the following, both procedures are described. In both cases the recorded data has to be checked, this is described in the section Data check.
Automatic procedure to take dark data
Go to the subscene AGIPD Dark Runs, click on Update Scenarios and options, this will ensure that the scenarios and Run and sample types that are available in the current Proposal will be displayed in the drop down menus and you can choose correctly. If you stick with the Proposal and there are no changes to the Proposal or Scenarios you just have to do this once.
- Choose the correct values for Gain Setting, # Pulses, and Repetition rate, for the Aquisition time 50s is sufficient for darks.
- Choose the correct Run and sample types for each run (the names of these will depend on the proposal, if it is not obvious consult the run coordinator).
- Press the button Take dark runs
- Check the data as described in the corresponding section Data check
Note
In case you cancel the procedure in mid-run please make sure that the the run is also stopped. Otherwise a lot of empty files will be produced.
Manual procedure to take dark data
In order to record data, use the part Copy of MID Run Controller in the agipd_overview scene.
Choose the values for pattern template, # pulses, repetition rate and Gain Setting. For the Aquisition time 50s is sufficient for darks.
Take one run these parameters and for each of the three pattern types Dark HG, Dark MG and Dark LG.
The Run Type and Sample have to be set for each run individually, for example sample type ‘no sample’ and Run Type ‘Calibration - Dark HG’ for the high gain dark run. To change Run Type and Sample, choose the correct one for each from the drop down menu of the “Copy of the MID Run Controller” and hit enter.
To take a run:
- Set the DAQ in monitoring (if it is not already) state by hitting apply configuration (check that the configure indicator is green) and monitor data (which should also turn the Monitor indicator green).
- Choose the correct Parameters and press Configure Detector and check in the mfpga log window below, the message “bunch structure loaded” should appear in both
- click Start Sending in AGIPD Combined Control to send data and start the Run by clicking on Start Run in the Copy of MID Run Controller
- When the detector stopped sending data (indicated by the Stop Sending button being greyed out and the fpga devices stop showing “Aquiring”) Press Stop Run in the Copy of MID Run Controller.
- Check that the data is in the folder: Open a terminal (or use the open one, it is usually there) and navigate to the runfolder. Go to the run folder on the online cluster ( , path: ‘/gpfs/exfel/exp/MID/2018[..]/p[proposelnumber]/raw/r[runnumber]’). h5 files should be produced for each module (‘RAW-R[runnumber]-AGIPD[modulenumber-s00[filenumber].hf’) as well as a files for slow data AGIPD1MCTRL00 and (‘RAW-R[runnumber]-AGIPD1MCTRL00-s00[filenumber].hf’, which contains the configuration and voltages and ‘RAW-R[runnumber]-AGIPD1MCTRL01-s00[filenumber].hf’, which contains temperatures and timing information). If there are modules for which only empty files produced, there might be a problem with the daq or these modules might not be sending data, please go to the Troubleshooting section for further investigation of the problem.
As soon as the Run is started in the proposal folder a folder with the run number is generated. Make sure that there are files for each module and that they have similar sizes. Every 250 trains a new set of h5 files is produced. If the run is started but the detector does not start immediately the first files of the modules can be empty, also if the run is not stopped soon after the detector stops sending data empty files for the modules are produced. In order to minimize the amount of empty data and if it is not required to record a specific number of trains one can also set the number of trains to up to ~60000, start the detector and then start and stop the runs, while the detector keeps sending data.
Data check (in case the lit frame finder is NOT used)
- How to check the data in the h5 files:
- First run the command ‘load module xray’, then open the file you want to inspect with ‘hdfview filename.h5’ The hdf viewer will open in a new window.
- In the left window, which displays the file structure, navigate to: INSTRUMENT -> MID_DET_AGIPD1M-1-> [modulenumber]:xtdf->data’
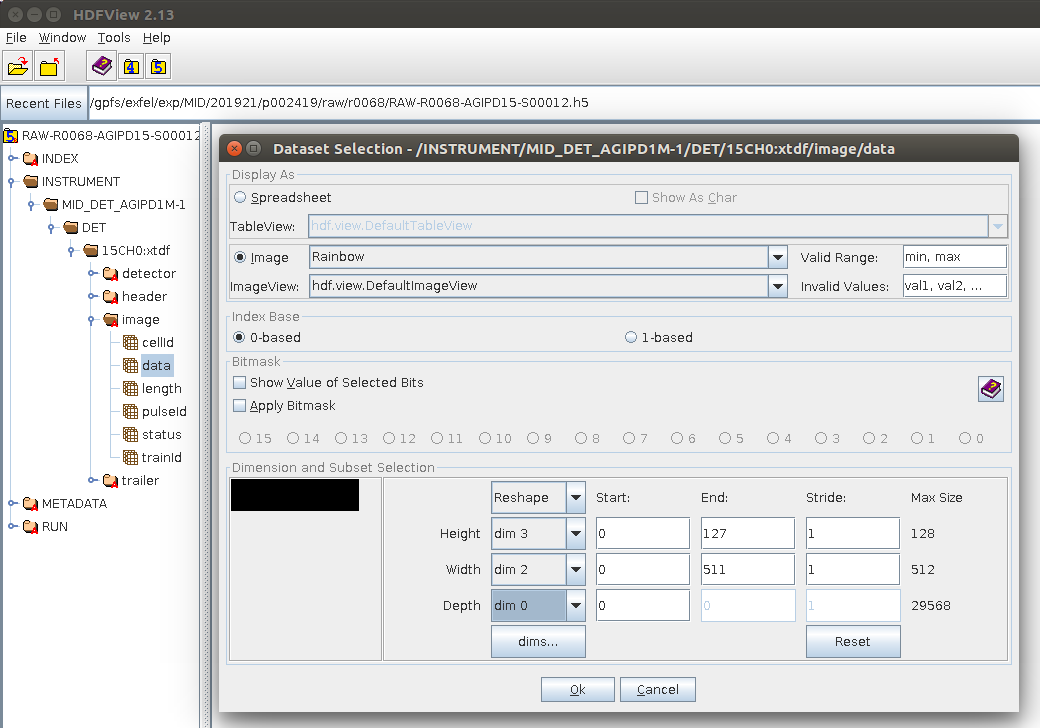
- right click on data and choose ‘open as’, in the window that opens choose for ‘Display as’ ‘Image’, set the Palette to rainbow. Set the dimensions to: Height=3, Width=2, Depth=0 (see also Fig. 11)
- click ok and observe the image. The values should be around 8000.
- go to the file structure again and navigate to: INSTRUMENT -> MID_DET_AGIPD1M-1-> [modulenumber]:xtdf->cellid’ and display the table. The cellids should count up to the cell number in the name of the scenario that is used. If there are jumps in the cellID number, or if the cell ID number 370 appears, the configuration has not been correctly applied - the run is bad and must be taken again
- navigate to: ‘pulseid’, if the scenario for 1MHz is used the pulse id should be 0,4,8…, if the scenario for 0.5MHz is used the pulse ids should be 0,8,16…
Timing Scan (to be updated, contact one of the experts if a new timing scan is necessary)
The Performance of the AGIPD detector is very sensitive to timing. To confirm or find the correct delay for the detector a timing scan has to be carried out and the resulting data has to be investigated. For this a run is recorded that includes data with a series of delays. From the curve of the mean signal in dependency to the delay the optimum value for the delay can be obtained. The value of the delay is given in the number of AGIPD clocks, 24 clocks amount to 220ns
There is a macro for the timing scan, which will change the delay for the given amounts of steps and step sizes and take one run to collect data while the delay increases. However, in order for the scan to be useful some preconditions have to be met. In case there is no other information given these are:
- Sample: preferably a copper target that produces flat field data, if this is not available a Lithium Titanate or another sample that produces rings (which is less convenient to analise)
- Run type “Calibration – Timing Scan”, Sample: “Cu”/“LiTi2O3“
- It has to be determined which is the suspected ideal delay (by calculation or “experimentally”) and verified roughly by observation of the preview. Check the elog for previous scans under similar conditions in the hutch and consult with the instrument what changes have been made since the last scan. During the initial search it is recommended to use rather more attenuation.
- A clear signal is needed: the intensity should be high, but in the ROI that will be analized later no gain switchig should occur.
- A stable beam and XGM data have to be available: since the mean signal will fluctuate with the intensity of the incoming beam the scan might be not useful if the beam is fluctuating too strong. In any case the XGM data for the beam intensity should be available in the data set to allow for correction.
- Pulse pattern from the machine: At least one pulse of X-rays is needed, the ideal pulse patterns contains X-rays in every 8th pulse to cover each memory cell row (while reducing the amount of radiation on the detector to what is necessary
In the AGIPD_overview scene is a sub scene for the timing scan.
Before executing the scan choose the parameters:
- The start delay will be the delay of the first trains that are recorded.
- Step size should be one.
- Aquisition time per step can be 3 to 5s
- The Number of steps should be high enough that it contains all delays for which signal is observed plus additional ~ 5 delay steps before and after the signal (+/- 16 around the value, that is suspected to be the correct one). Please verify this by observing the preview during the scan.
In principle not a full set of modules is necessary for the timing scan, so in case data aggregators stop working the scan does not have to be cancelled as long as there is still data from modules on which there is a good signal. This is required for at least one module per detector half.
To make a judgement on the correct value for the delay, corrections should be applied given by the dark runs (offset correction) and by the XGM data to correct for instabilities of the beam. The region of interest, that is used for the analysis should contain a signal that is well above the noise (> 500 ADU) but still low enough that no gain switch occurs . The XGM-corrected mean signal level in this region of interest is plotted against the trigger delay for different memory cells.
The image shows an example for a timing scan:
The ideal delay value is the one before the drop of the signal. In a second step it can be verified that the gain in the regions where gain switching occurs is not negative (this would be an indication that the value for the delay is too high).
The evaluation of the delay should be done for both halves of the detector!
For the evaluation a notebook is provided by DA, it can be found on Gitlab: <https://git.xfel.eu/gitlab/dataAnalysis/calibration-services#how-to-use-at-xfel> The full and most recent instructions for installation and use of the notebooks are also available in the readme: https://git.xfel.eu/gitlab/dataAnalysis/calibration-services/blob/dev/README.md
During beamtime it is convenient to run the notebooks on the online cluster to avoid having to wait for migration to the maxwell cluster
- Get the repository in your workspace on the online cluster: user@machine git clone https://git.xfel.eu/gitlab/dataAnalysis/calibration-services.git Notebooks are available in the folder calibration-services/notebooks
- Running a jupyter server on the online cluster via FastX: Open a terminal and type the following commands
- user@max-display: ssh exflgateway
- ssh exflonc<NN> #NN = 12 for eg.
- module load exfel calibration-services
- jupyter-notebook - -port 8008 - -no-browser This will start a jupyter server on online cluster and a link will be provided that you can copy.
- Now open another terminal and do the port forwarding: user@max-display: ssh -L 8008:localhost:8008 exflgateway -t ssh -L 8008:localhost:8008 exflonc<NN>
- Open your regular browser and paste the link that you copied before the last step. Provided you have cloned the repository as shown in first step, the calibration-services folder will be visible in the jupyter notebook.
- From the hutch control room computers: Open a terminal and type the following commands
- ssh exflonc<NN>
- module load exfel calibration-services
- jupyter-notebook - -port 8008 - -no-browser
- Open another terminal and do the port forwarding
- ssh -L 8008:localhost:8008 exflonc<NN>
- Open your regular browser and paste the link that you copied before the last step.
