Troubleshooting
This section mentions known problems and how to react to them
Links
Additional troubleshooting guides available:
For of problems that cannot be solved with these guides the instrument calls the DOC for help during operation. DOC will call second level support if necessary.
Cooling issues
Cooling procedure does not start
- Check state of the Cooling procedure, if it is ‘unknown” try to reset
- Check whether cooling is allowed, if it is interlocked go to Interlock issues
- Check the status of the Julabo chiller (is “Chiller ok” green in the cooling control subscene). In case of an issue check the Julabo chiller in the rack room and follow the manual for the Julabo
Detector does not cool down
If one or more of the cooling Blocks do not get cooled down but get stuck at around 0 degC, the reason might be that ice was formed due to water in the cooling circuit. Please inform users, it might be necessary to heat up the circuit to +45 degC to get rid of the water.
Power issues
Channels do not power up (or down)
If the channels do not power up (or down) even when using the manual procedure:
Go to AGIPD_POWER subproject and check the status of the corresponding HV or LV device ( MID_EXP_AGIPD1M/PSC//*)
if the device is shut down: reinstantiate
if the device is in error: try to reset the error or shutdown and reinstantiate the device
if the device is instantiated and without error:
- navigate to Channels (last in the list) and unfold the channels to check whether the information for “Tags” is there (as can be seen in Fig. 13, check for the first channel and the last, where voltage should be applied)
- if there is no tag information try to reinstantiate the device
If none of this works call DOC/Controls OCD (the power xml configuration file is not acccessible)

Channel 901 tripped, ‘sense voltage too high’, power of the detector is down.
Channel 901 is the channel for the microcontroller, if this trips the wing that is affected will power down to the point where only 900 is on, 901 displays ‘sense voltage too high’ in red, channels 902 and 903 will be off, all other will be interlocked.
If this happens, power cycle the detector:
Switch off by clicking ‘Emergency off’ in the subscene AGIPD Power.
Check the MPOD feedback in the browser, make sure that all channels are either ‘off’ or ‘interlocked’.
If not: press ‘Emergency off’ again.
Power the detector as described in the corresponding section.
ASIC power channel trips
It can happen that one or two channels for ASIC power trips. It was observed on channel U302 for wing 2.
Do not panic! It is not necessary to power down the whole detector!
- Stop detector ( in case is sending data)
- Check in the corresponding configuration table ( displayed in the scenes power_lv_h1 or power_lv_h2) - the “tags” (i.e. q,m..) for this channel
- Go to the manual_power scene to power down just the asic of the affected module. (For example channel U302 for half 2 has the following tags “asic,h2,q4,m1,v2”)
- For the module QxMy you should put in the Tag field “asic,qx,my” then click ‘OFF’
- power up the module
- Start detector to properly initialise the ASICs
- Check if the image quality in the online preview still looks fine.
Start up issues
Failure of Automatic power procedure
Check how far the procedure got and which channels are already powered
- If no channels are powered, or if you observe any tripped channels go to Power issue
- You can try to go on with the manual power procedure
- Or give the automatic procedure another try:
- Reinstantiate the power procedure device
- Press ‘Emergency Off’ and verify that all channels are off or interlocked in the mpod browser feedback
- follow the automatic power procedure
Detector is not sending data
- Check, whether the fpga devices show the state ‘Aquiring’ in the combined control scene. If not or only half of them are in the ‘Aquiring’ state, as a very first check stop sending data, configure again (check that you choose operation parameters that are known to work) and wait a second before pressing the ‘start sending’ buttons.
- Check with Rundeck whether it is actually the detector that is not sending data, see Verify, that detector is not sending data
- After confirming that the issue is on the detector side further troubleshooting depends on whether a complete half of the detector is affected or single modules.
Modules are not sending data
If at least one module from each half of the detector is sending data, the possibility that the reason is the configuration or the c&c signal is already ruled out:
- try to power cycling the system.
H1 and/or H2 are not sending data
- Reconfigure the detector (check that you choose operation parameters that are known to work) to verify that there is no issue with the configuration, then try sending data again
- Check the MFPGA log windows for unusual feedback:
- If there is not an update every second go to MFPGA feedback is not updating
- If the MFPGA feedback keeps saying “Stopped at 66” Go to MFPGA feedback only updates “Stopped at 66”
- Stop the detector and check whether the feedback in the corresponding MFPGA log window changes to “Null Stop” and that it is updating.
- If the feedback does not change to “Null Stop” go to Detector keeps “Running” when stopped.
- If all else fails: try power cycling
MFPGA feedback is not updating
One of the log windows in the AGIPD combined control subscene (that say ‘Null Stop’or ‘Stopped at…’ with a timestamp) are not updating each second.
First check that the detector is not in the process of applying the configuration or number of trains (the updates will stop temporarily during this process). If you are sure that this is not the case:
- shutdown and re-instantiate FPGA devices from cppSPB/AGIPD server
- Press ‘initialize Asics’ in the combined control scene
- Configure detector, wait till state of the composite is Active.
If it does not help, please power cycle the system
Detector keeps “Running” when stopped
The update window of the MFPGA (can be only one wing or both) keeps updating after data starts to be sent but only updates “Running” instead of changing to “Stopped at [some number]” now and then.
- Stop the data taking.
- If the MFPGA of the affected half will not go back to “Null Stop” but keep on updating “Running”, power down the asics in the manual_power scene by setting the Tag to ‘asic’, hitting enter and then clicking on ‘off’.
- When the asics are off, try to resubmit the configuration (possibly twice).
- Stop the affected half by navigating to the device in the GUI and press “Stop”
- If that works and the detector starts updating ‘Null Stop’, try again to push data and to stop again
- If the detector behaves normalpower up asics again and check the preview.
If resubmitting the configuration does not work power cycling is necessary.
MFPGA feedback only updates “Stopped at 66” and no data is send
If one of the MFPGA log window keeps displaying “Stopped at 66” and no data is sent from the detector:
Stop the detector and check whether the display changes:
- If “Null Stop” is displayed: try to reconfigure and start again.
- If the log window keeps on displaying “Stopped at 66” and stops, when “start” is pressed, there might be an issue with the clock and control system:
- Check, whether the c&c cables are connected
- Confirm with AE that there is no issue with the C & C crate
If no issue can be identified, try power cycling.
Verify with Rundeck, that the detector is not sending data
In order to check, whether the fault is already on detector side one can use the tool Rundeck.
- Find the link ( remcom.xfel.eu/project/SPBDAQ ) to the login page of the tool bookmarked in the upper bar of the browser of the gui pc (look for ‘Rundeck login’).
The username to login is SPBDAQ, the name and password are saved.
- Make sure that the detector is sending data and start a new job for ‘DAQ Data Aggregators Network Traffic’ for this select all the nodes that belong to module data and click ‘Run Job Now’.
The nodes spb-br-sys-daq-00 to -15 belong to the 16 modules, the allocation of the nodes to the modules is shown in Figure Fig. 3 in the introduction (and also hangs out in the hutch). The nodes spb-br-sys-daq-da01 and 02 belong to the slow data.
- Observe while the job runs: all nodes will be listed, and disappear one after another from he list. If nodes stay exceptionally long, this is already an indication that there is a problem with the data from the corresponding module.
- When the Job is finished go to ‘report’. Check the reports from the suspicious nodes whether packages were sent.
Possible results:
- If all module sent data packages to the correct IP the problem is in all likelyhood on the daq side, please consult ITDM.
- If no data is coming from a complete half of the detector (or both) go on troubleshooting at H1 and/or H2 are not sending data
- If there is one or more modules that stay in the list and the report says ‘0 packages captured’ but there is still data from some module of each half, try to power cycle the system.
Issues with data taking procedures
Dark Data procedure goes to error state or gets stuck
If starting the Dark Data procedure results in an error of the procedure or the procedure gets stuck, please check that the conditions for the procedure are met:
- Please stop the detector before starting the procedure
- Do the Run and Sample Types exist in the proposal that was set?
- Where Scenarios and Options updated in case the proposal was changed?
- Make sure that the DAQ_Controller state is not in error or unknown, if necessary re-instantiate the device
Reset the Dark Data procedure with the reset button on the scene, check that the conditions above are met and try again. In case it is not possible to resolve the issues one can take the darks manually as described in “Manual procedure to take dark data”
Issues with applying configurations
Combined Control and/or MFPGA devices are in error
If the MFPGA devices and composite went into error state (this can for example happen if the configure button gets clicked accidentally twice in quick succession) go to subproject AGIPD_CONTROL and “reset error” in the MFPGA devices (FPGA/MASTER_H1 and FPGA/MASTER_H2), then try to configure again. If the FPGA_COMP (subproject AGIPD_CONTROL_MDL) goes into error again upon trying to reconfigure: reset the device and try initializing the asics again ( with the respective buttons on the scene) then reconfiguring should work again. In some cases resetting the error on FPGA_COMP has to be repeated.
Image Performance Issues
Online preview is not updating
If the online preview does not update, there is a variety of possible reasons, and several things can be checked:
- The detector does not send data - this can be checked with Rundeck, see the last section
- Make sure DAQ is monitoring (indicators next to Monitor and Configuration in the Copy of SPB Run Controller are green - if not click apply configuration and Monitor
- The detector is not configured correctly. If the Detector was not configured correctly the online preview might not be able to use the data that arrives from the detector - Check, whether the configuration scenario is one of those displayed in the hutch as up to date, reapply the configuration and set the number of trains, then try again to push data.
- Issues with the DAQ that affect the preview - You can cross check by taking data and checking whether image data for the modules has sufficient size to make sure to rule out there is a problem with the DAQ
If all of this issues are cleared please refer to the online calibration troubleshooting guide for trouble shooting and a description for restarting the calibration pipeline
Corrected image performance is not as expected
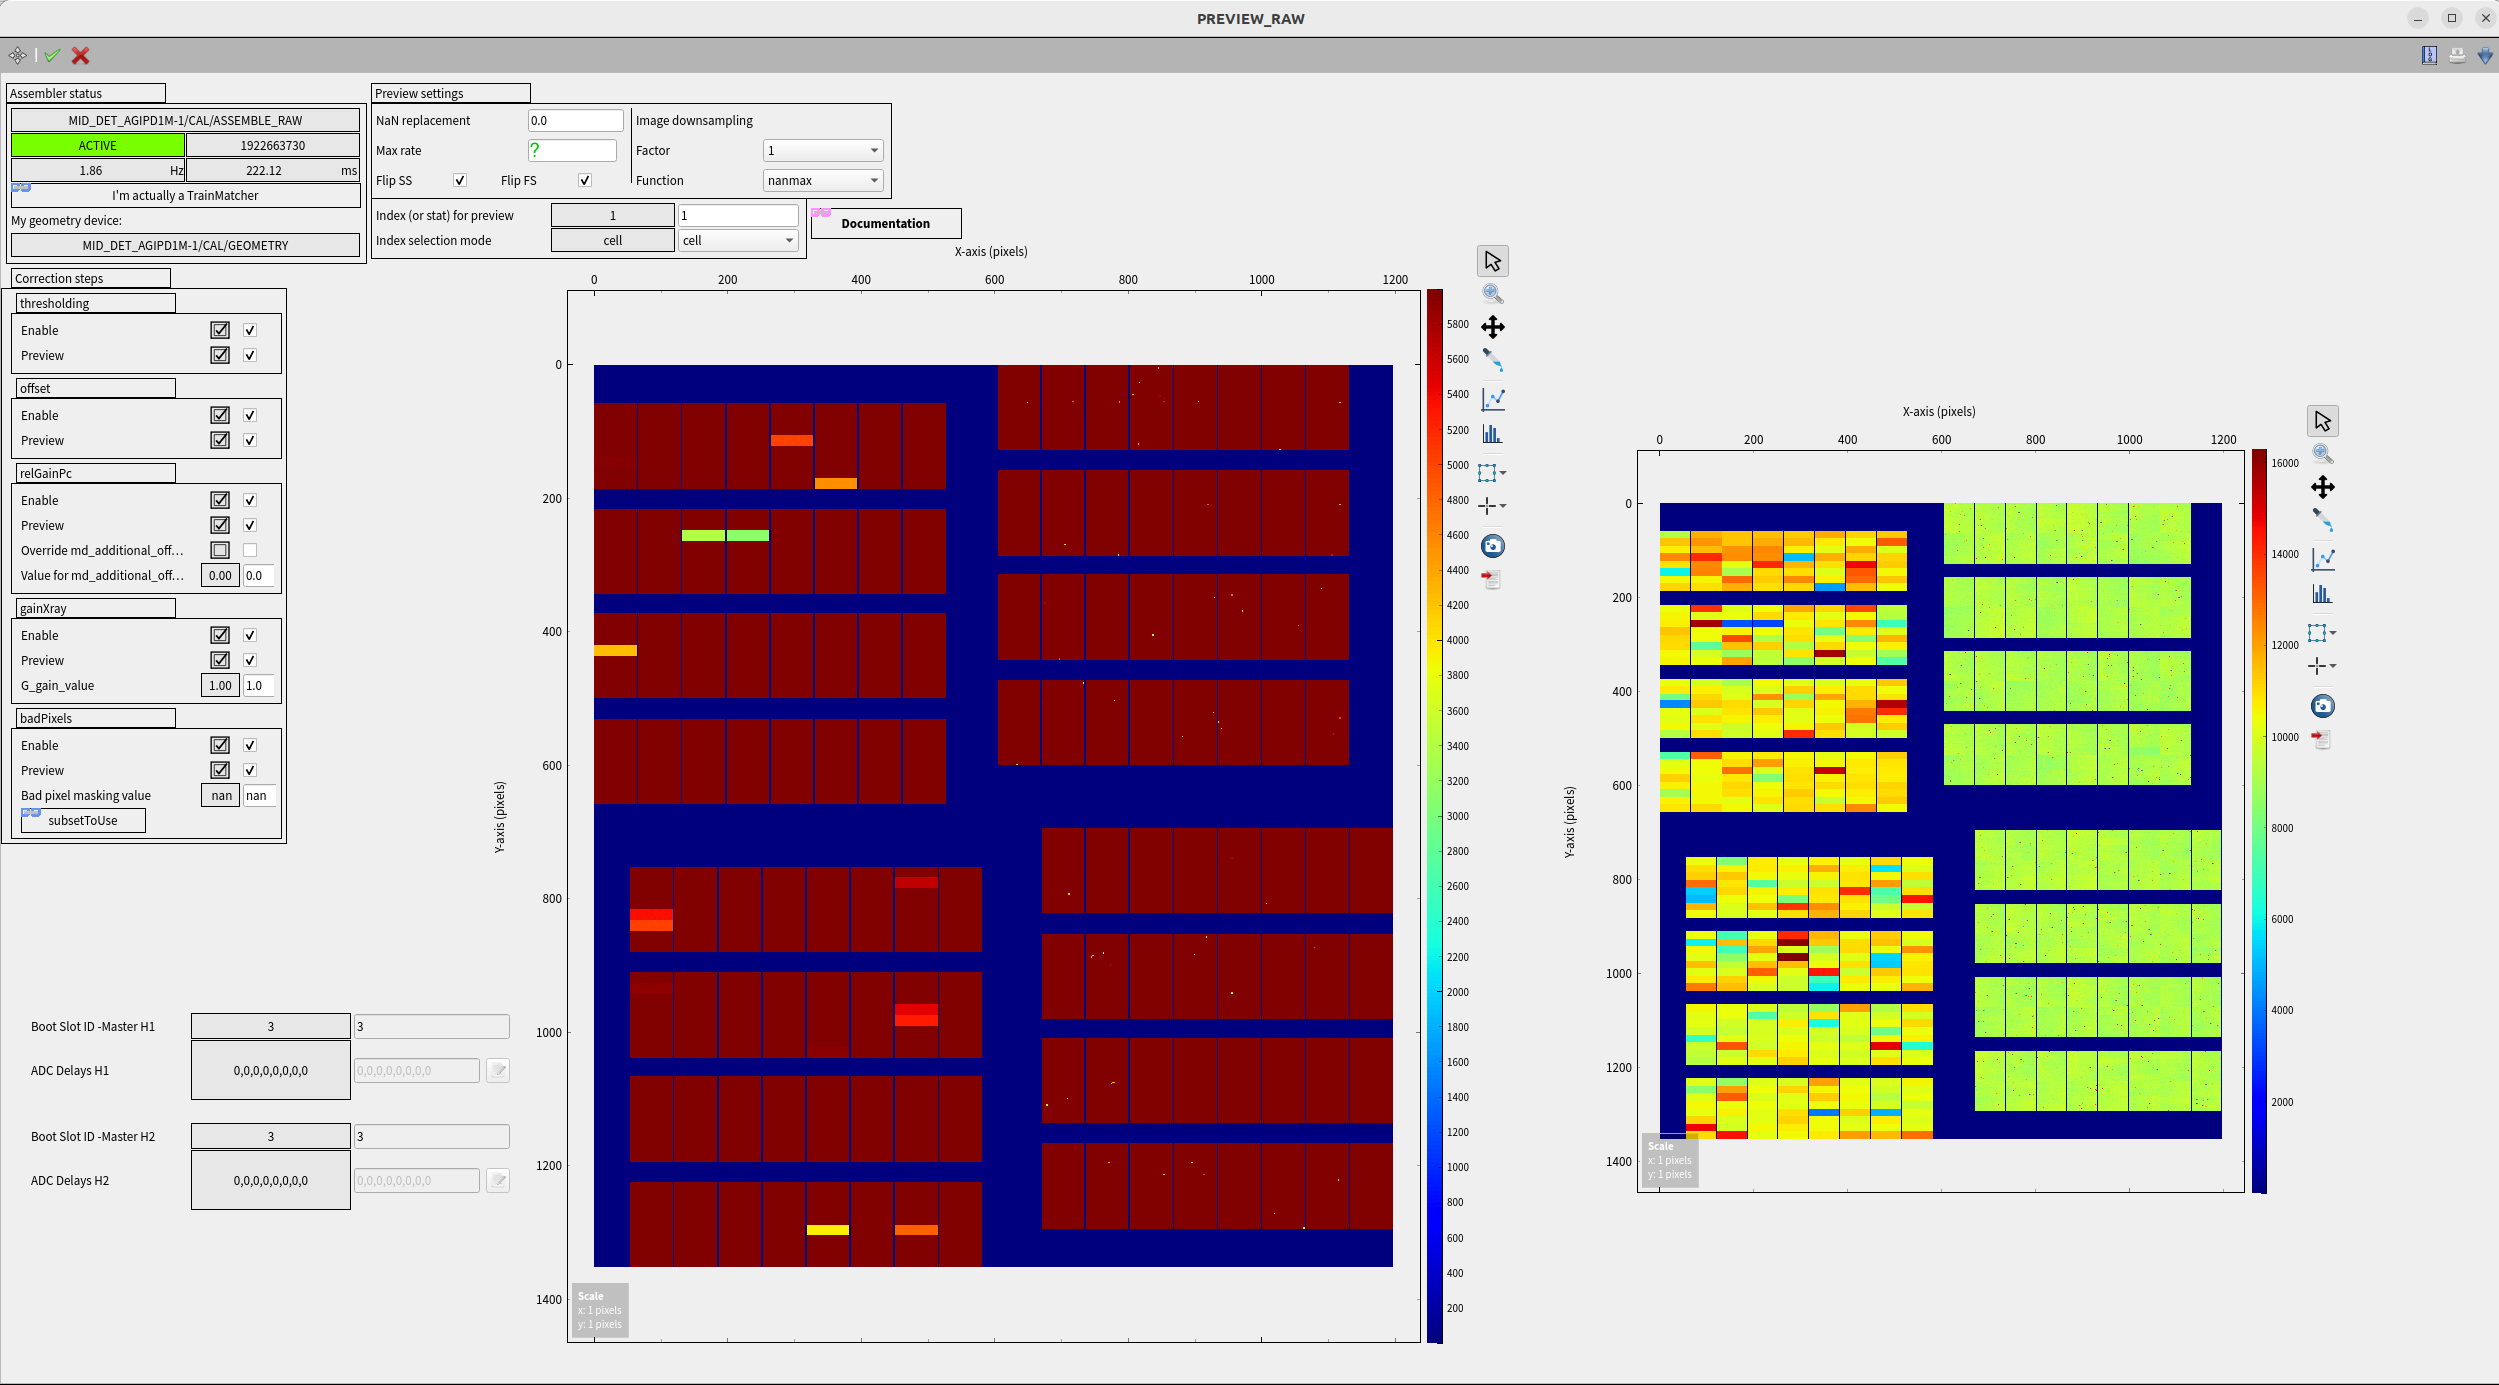
In case any features are observed on the corrected preview please verify that they are observed on the raw preview as well. For reference what the raw preview is expected to look like check the printout in the hutch.
- If the raw preview looks as expected:
- check that the parameters for the calibration constants are correct for the current operation scenario
- refer to the online calibration troubleshooting guide
Interlock issues
In case the interlock is triggered first verify the status of the of the vacuum and cooling system (in the AGIPD overview scene):
- check the vacuum system, if it is not ok:
- make sure the detector is warming up
- switch OFF the detector power
- restore vacuum as soon as possible
- check temperatures of cooling blocks and status of Julabo chiller, if they are not ok:
- check the Julabo Chiller in the rack room and follow the Julabo manual
- check temperatures of external housing and the status of the K3 chiller in the hutch, if they are not ok:
- check the K3 chiller in the hutch and follow the K3 manual
Warning
If the detector was accidentally vented (>1 mbar): confirm with DET before cooling down again and powering.
Interlocks cannot be armed
When the interlocks cannot be armed even though all prerequisites are met, please go to the agipd_interlock_control subproject, shutdown the device servers under ‘mdlSPB/AGIPD’ and instantiate them again.
MC live signal tripped
In case of trip of MC live signal the microcontroller and efans will still be on all other channels will be in interlocked state. If there is no issue with with vacuum or cooling (see above): power cycle the detector. It will be necessary to either power down manually or with the ‘Emergency off’ button.
Interlock triggered by pressure spike
In case Detector was warmed up due to interlock trip caused by a short(!) pressure spike (i.e. due to injection of sample):
Warning
This only applies if the pressure did not rise above 1 mbar and the vacuum was restored immediately. Otherwise this has to be treated as interlock issue
- If the detector was warmed up above -5 degC (i.e. temp. of cooling blocks > -5degC): switch OFF the detector power
- Make sure that the vacuum condition are fine, i.e. the state in SPB_IRU_CHL/DCTRL/CHILLER device is not INTERLOCKED.
- Press reset in the automatic procedure.
- Try to cool down the detector with the automatic procedure. For any issues that occur while cooling down refer to the section cooling issues
Warning
Please do NOT try to cool down the detector if the state of the chiller is INTERLOCKED.
Grafana Panel for the DOC shifters
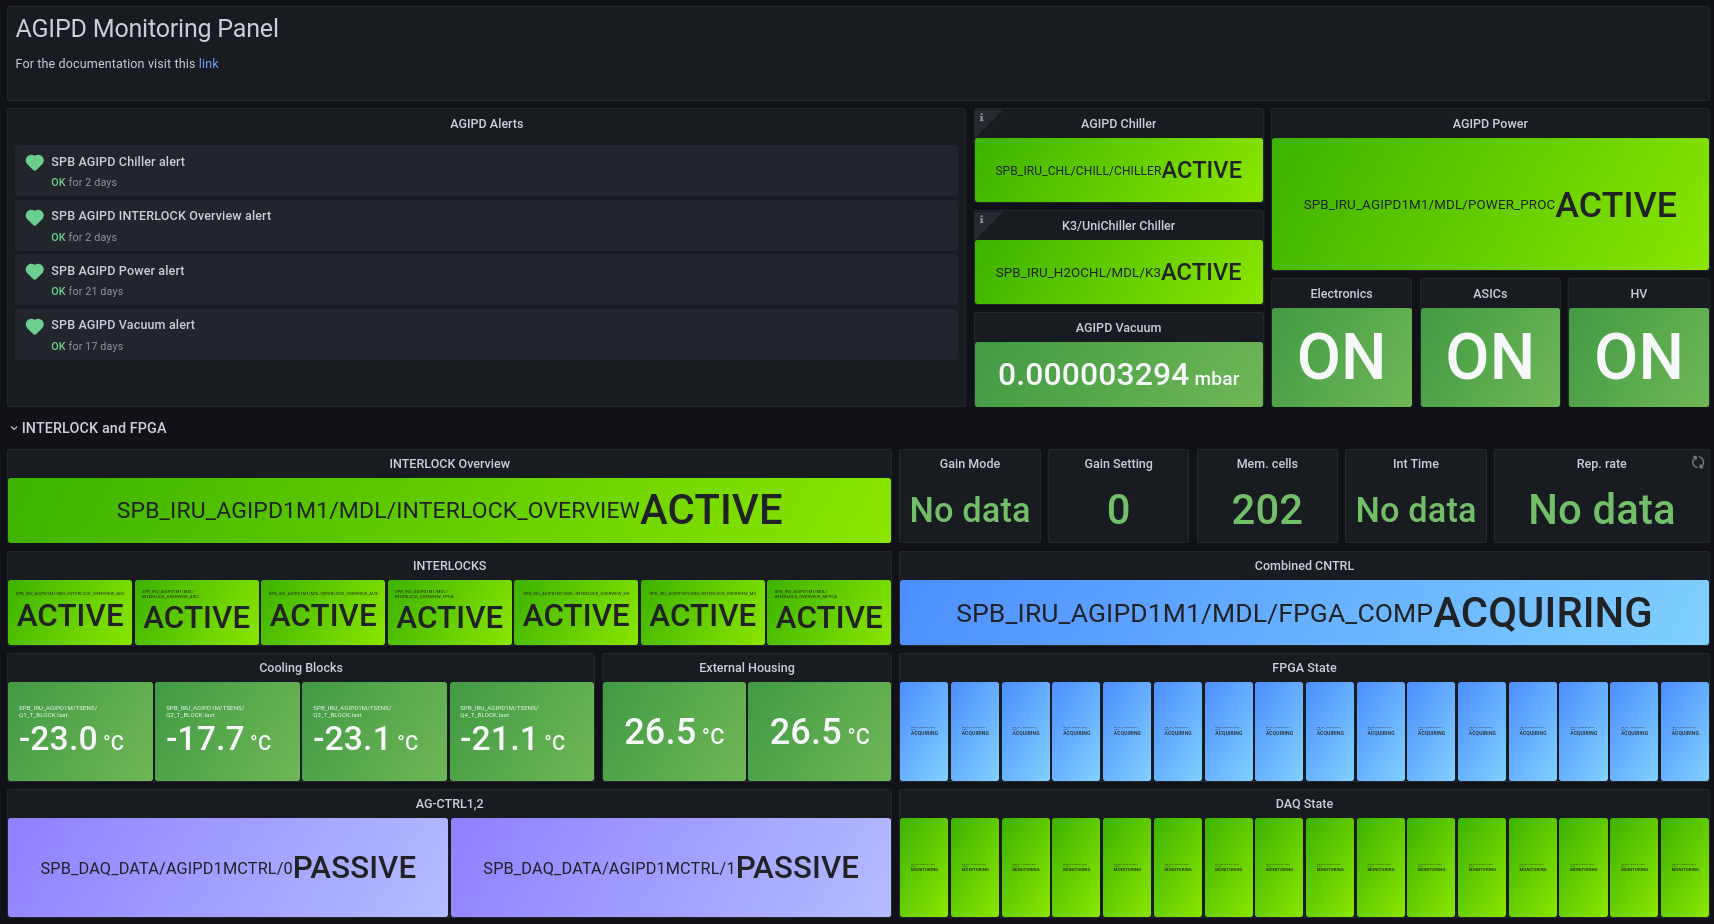
People who work on the DOC shift will notice an issue or start an investigation on the AGIPD monitoring Grafana Panel ( https://ctrend.xfel.eu/d/wfNl2EYGz/doc-agipd-monitoring?orgId=1&refresh=5s ) and go on from there. For Documentation about the panel also refer to https://redmine.xfel.eu//projects/data-operation-center/wiki/AGIPD_Monitoting , this link is also found on top of the Grafana Panel.
Please also take note of the OCD guidelines in this manual: https://rtd.xfel.eu/docs/agipd-manual-mid/en/latest/OCD_guidelines.html
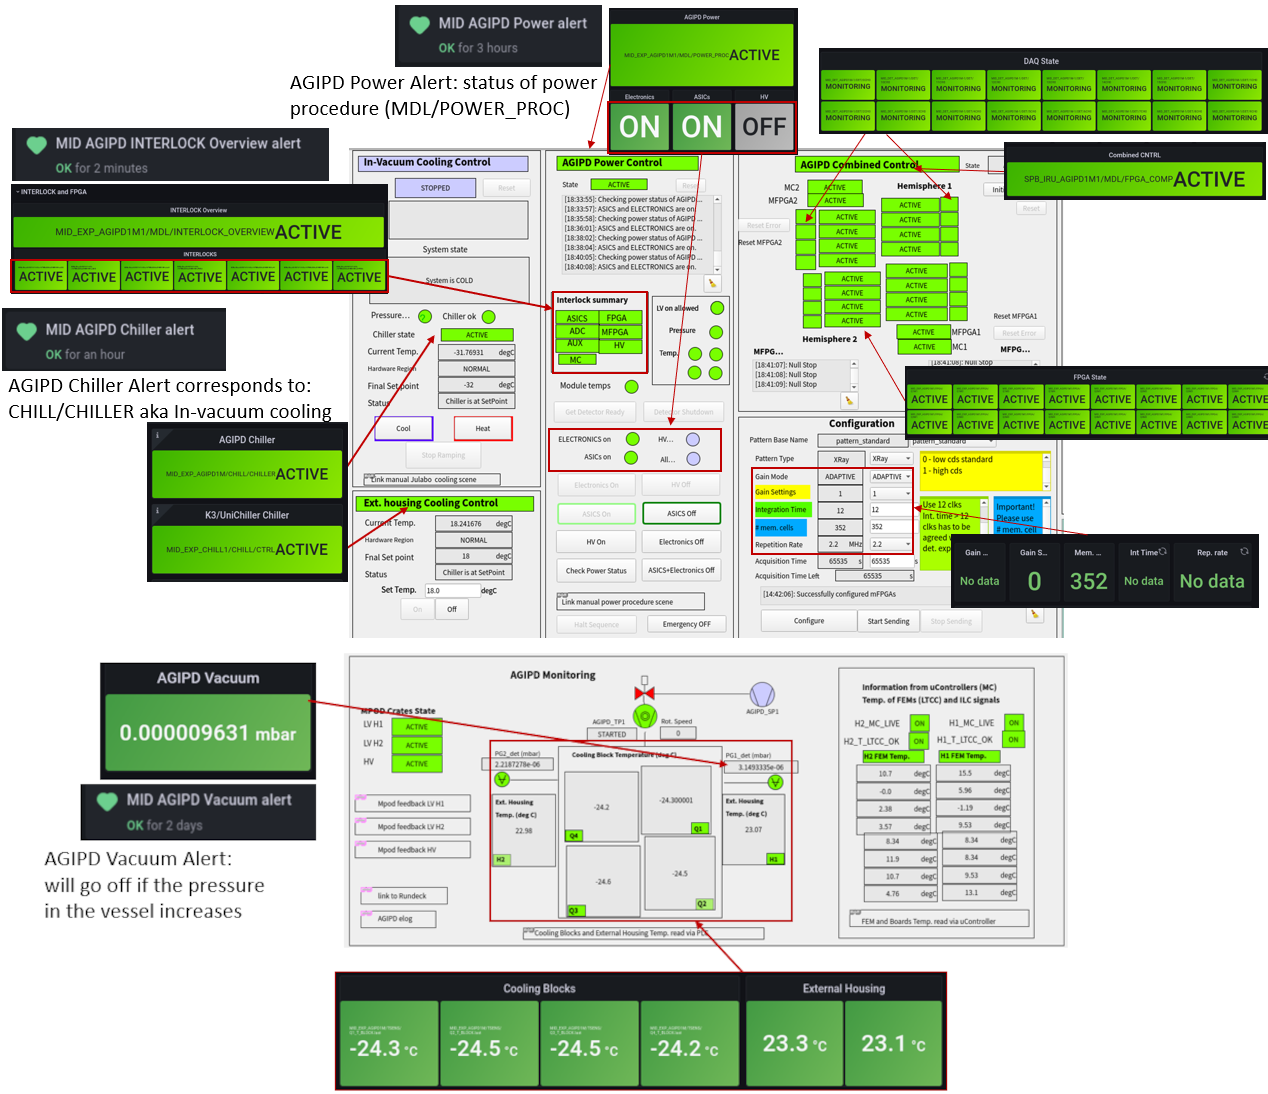
Figure Fig. 15 shows the AGIPD Monitoring Panel of Grafana (without trendlines) and in Fig. 16 it is depicted which panel corresponds to which indicator in the main overview scene of AGIPD.
Grafana alerts
SPB chiller alert
- Will go red if the bath temperature deviates more than 2 degree from the nominal value of -32°
- to check in the AGIPD main Scene in Karabo: Subscene ‘In-Vacuum Cooling Control’ and ‘AGIPD Monitoring’ subscene in case of issues with the pressure in the vacuum vessel.
- Possibly helpful troubleshooting sections: Cooling Issues and Interlock Issues
SPB AGIPD chiller alert
- will go red if the bath temperature deviates more than 2 degree from the nominal value of -32°
- to check in the AGIPD main Scene in Karabo: Subscene ‘In-Vacuum Cooling Control’ and ‘AGIPD Monitoring’ subscene in case of issues with the pressure in the vacuum vessel.
- Possibly helpful troubleshooting sections: Cooling Issues and Interlock Issues
SPB AGIPD Vacuum alert
- will go red if the pressure rises above 10^-5 mbar
- to check in the main scene: subscene ‘AGIPD Monitoring’ shows the the pressure in the Vessel (P_FR_det) as well as the states of other components of the vacuum system which might give a hint for the reason, in any case communication to the instrument is necessary
- Possibly helpful troubleshootimg sections: Interlock Issues
SPB AGIPD Power alert
- will go red if the automatic power procedure is in error state
- to check in the main scene: in subscene ‘AGIPD Power Control’, as first step the automatic procedure device can be reset and the status checked with the ‘Check Power Status’ button.
- Possibly helpful troubleshootimg sections: Start up Issues
SPB AGIPD INTERLOCK Overview alert
- will go red if any of the interlock devices that correspond to the different electronic parts of AGIPD prevent them from being powered. Since for different electronic parts different conditions have to be met there could be a range or reasons
- to check in the main scene: in subscene ‘AGIPD Power Control’ check under ‘Interlock summary’ which part of the AGIPD is interlocked, the indicators next to it (Pressure, Temps etc) give an indication for the reason, as usual check the ‘AGIPD Monitoring’ subscene, specifically the ‘Information on uControllers’.
- Possibly helpful troubleshootimg sections: Interlock Issues and Power Issues


