General Online Calibration Troubleshooting
Restart Servers Script does not run through
Restarting the calibration pipeline servers is the initial step of re-initializing the larger calibration pipelines. For AGIPD, DSSC and LPD, this is done using the restart server script (see Restarting Online Calibration). In case of misconfiguration or addition of new servers this script has stalled in the past. You will see this if updates in the restart server status field stop before “Restarted all servers” is displayed. Failures have previously occurred for the following reasons:
a new device server had been added on one of the hosts the restart works on:
Instrument Hosts Account SPB spb-br-sys-cal-[0-7] spbonc FXE sa1-br-sys-cal-[0-7] fxeonc SCS scs-br-sys-cal-[0-7] scsonc SQS sqs-br-sys-cal-1 sqsonc MID mid-br-sys-cal-[0-7] midonc HED hed-br-sys-cal-1 hedonc Such new device servers, which should usually not be restarted, need to be added to the Omit from restart field of the RESTART device which an expression that matches (parts of) the server naming (see Fig. 14).
a webserver on one of the hosts is not running. The restart works by calling karabo webservers. Hence, if they are not running, it will fail. SSH onto the respective hosts (see table above) and check that the servers are running:
source /scratch/[account]/karabo/activate
karabo-check
Should include a line
webserver: up (pid 1249) 2475094 seconds, normally down, runningIf not one needs to investigate why it is not running (CAS OCD will help).
a webserver used to restart calibration is misconfigured in its filter settings:
[spbonc@exflong01 ~]$ cat /scratch/spbonc/karabo/var/service/webserver/run
#!/bin/bash
# this file has been generated by ansible
exec 2>&1
exec envdir ../../environment env \
karabo-webserver serverId=webserver \
--port 8080 --filter cppspb_spb_cal_1 pyspb_spb_cal_1 mlspb_spb_cal_
Note how it will only act on the servers specified. If a server runs on that host that does not match this criterion and is not exempt by the omit from restart settings, the restart will stall.
the template used to address the webservers is misconfigured in the RESTART device.

Fig. 14 The RESTART device configuration
Start Pipeline Times Out on Initializing Devices
If the restart ran successfully and reinitializing devices has failed when clicking on Start Pipeline. This has happened for the following reasons in the past:
the Detector is actively pushing data during a restart. This might result in a device not correctly initializing. In general: the DAQ can stay in Monitoring mode during restart, but the detector must not send data! If this happened restart the servers, and then try again.
a Karabo installation on one of the hosts was not started at all. Check on each of an instruments hosts
Instrument Hosts Account SPB spb-br-sys-cal-[0-7] spbonc FXE sa1-br-sys-cal-[0-7] fxeonc SCS scs-br-sys-cal-[0-7] scsonc SQS sqs-br-sys-cal-1 sqsonc MID mid-br-sys-cal-[0-7] midonc HED hed-br-sys-cal-1 hedonc that Karabo is running:
source /scratch/[account]/karabo/activate
karabo-check
If not start it:
karabo-startand try again.
the execution environment of a GPU enabled server is not configured properly:
cat /scratch/spbonc/karabo/var/service/pyspb_spb_cal_1/run
#!/bin/bash
# this file has been generated by ansible
exec 2>&1
exec envdir ../../environment env \
PATH=/usr/local/cuda-10.1/bin/:$PATH \
karabo-pythonserver serverId=pySPB/spb_cal_1 \
Logger.priority=INFO
Note how CUDA is added to the path. In general the code should not fail if no GPU is present, but rather it will lead to much slower processing (see …) for details)
Also, cross check that the used CUDA version is installed and available.
ll /usr/local/cuda-10.1an older installation has been started and device ids are already in use. This has happened a few times. Before we had GPUs available the online calibration was installed on other (CPU) only hosts. From time to time, something or someone seems to start these again, conflicting with the current installation. No calibration devices or servers should be running on exflonc hosts for the large detectors. You can check e.g. via iKarabo.
Calibration Parameters are not loaded
After initializing devices the calibration manager device instructs all processing devices to load their respective calibration parameters. This will usually show itself by having the calibration devices stuck in CHANGING state and the calibration parameter dates empty. This has in the past failed for the following reasons:
the detector is producing data when constants are loaded. This might lead to failures. Stop the detector, restart the pipeline and try again.
the calibration DB remote devices are not running. These devices are under ITDM responsiblity, but may sometimes have note been initialized yet after a reboot or power failure. In general they run on the same hosts as the calibration pipeline under the xcal account:
Instrument Hosts Account SPB spb-br-sys-cal-[0-8] xcal FXE fxe-br-sys-cal-[0-8] xcal SCS scs-br-sys-cal-[0-8] xcal SQS scs-br-sys-cal-[0-8] xcal MID mid-br-sys-cal-[0-8] xcal HED mid-br-sys-cal-[0-8] xcal Note how the instruments without MHz detectors also use these devices.
You can identify this problem by grepping the calibration device logs for Resource temporarly not available:
grep "Resource temporarily" /scratch/scsonc/karabo/var/log/pythonserver_scs_cal_1/current
WARN  SCS_CDIDET_DSSC/CAL/OFFSET_CORR_Q1M2  : Could not find constant Offset: Resource temporarily unavailable
WARN  SCS_CDIDET_DSSC/CAL/OFFSET_CORR_Q3M2  : Could not find constant Offset: Resource temporarily unavailable
In such a case check the respective devices responsible for the SASE:
ssh xcal@spb-br-sys-cal-0
[xcal@exflong08 ~]$ source /scratch/xcal/karabo/activate
[xcal@exflong08 ~]$ karabo-check
pythonserver_sa1_daq_rcal_0: up (pid 32532) 59542 seconds, normally down, running
If the server is not running, restart it or resolve the problem. The devices are configured to auto-start. Then restart the pipeline.
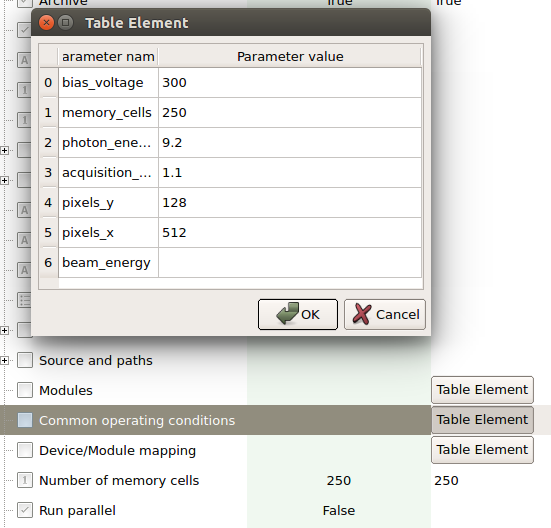
detector operating settings do not match anything in the database. To investigate this, first check the the common operating conditions set on the CAL_MANAGER device if they are what you expect (if you know what to expect that is). An example is shown in Fig. 15. Note that beam_energy should usually be empty. Also you do not want any fields to display “None”. If this is the case, delete “None” such that the field is empty, or set it to a value.

Fig. 15 Example of common operating conditions for the SPB AGIPD.
If you do not know what to expect, chances are that the last offsets were injected with reasonable settings to the calibration database. To check to the following:
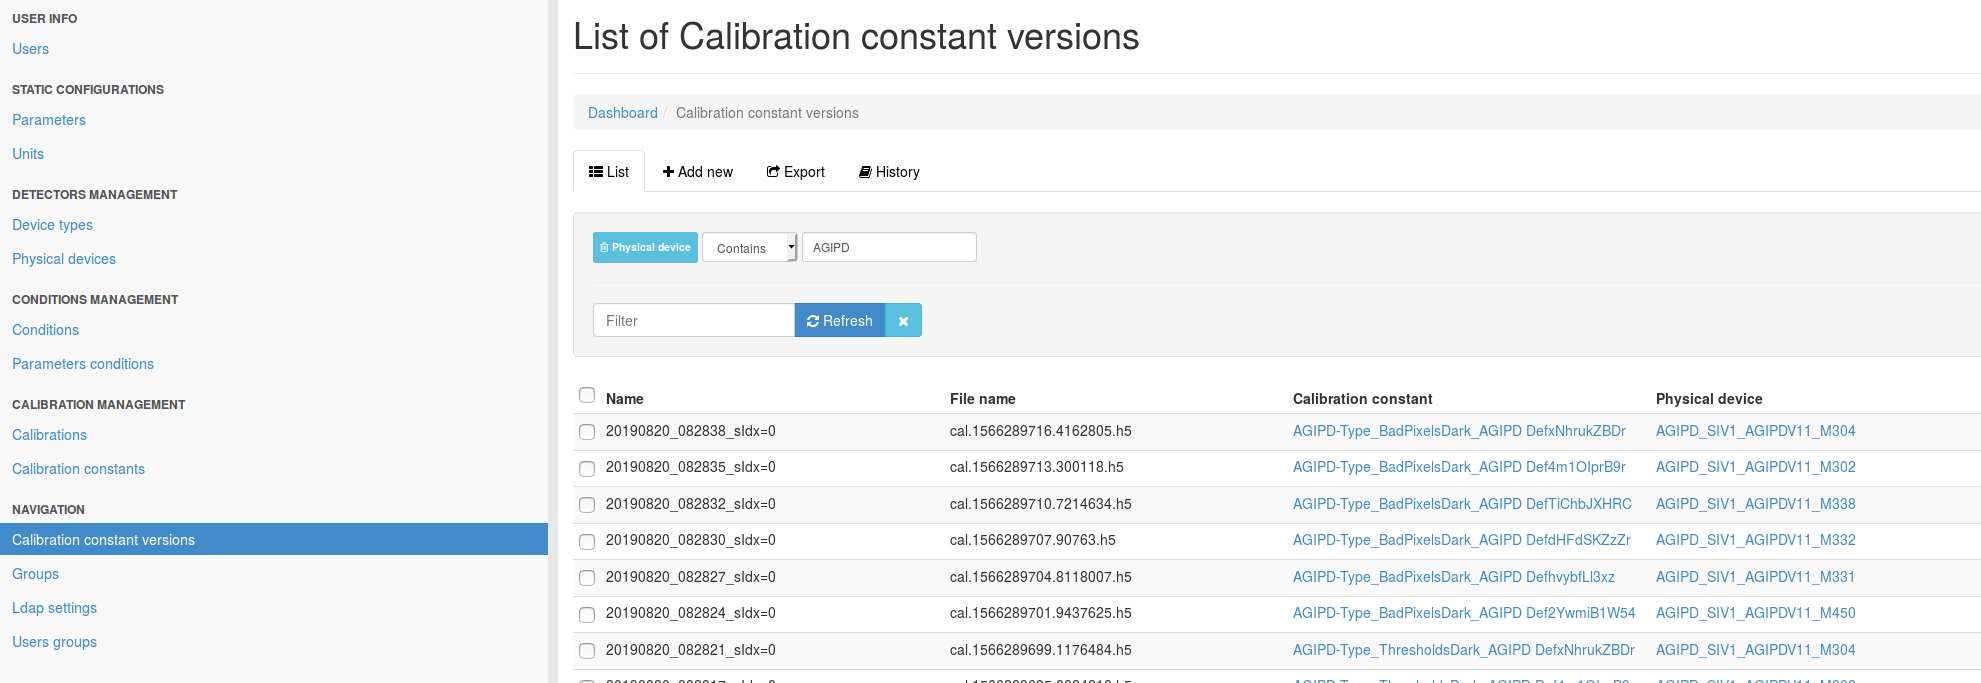
Navigate to the database backend and log in. Click Admin->Calibration constant versions and filter for the detector you are investigating by adding a physical device filter:

Fig. 16 Example of constants injected into the calibration database.
Note that for AGIPD you will need to differentiate MID and SPB instances. If you know approximately when the last dark run was taken you can usually do this via the Start date column. If not, you will find the current module mapping here. The SPB AGIPD is the AGIPD1M1 instance, the MID the AGIPD1M2 instance.
Click on a constant which contains the work Offset in its name. The click on the link under Condition. Here you will now find a list of Parameter conditions which you can inspect to see if their values match the expectations in the common operating conditions field.
Note that the field will likely contain additional parameters not applicable to calibration parameters produced from dark images. These change much less frequently though, so setting the appropriate parameters for dark image derived parameters will suffice in most cases.
Once you are done, click apply all on the calibration manager device, then click reset and finally init.
Note
The AGIPD pipeline will run if no flat field constants (FF) are found.
“Wrong” Calibration parameters are loaded
Sometime other parameters than expected seem to be loaded. Most frequently, offsets are of older date than the users expect. Verify the following:
- have new offsets been characterized?, e.g. has the procedure for dark characterization been followed (see Requesting Dark Characterization). Has data been been migrated, before running the script? Is Maxwell particularly busy, such that jobs are queued? In this case it is advisable to wait till the jobs are finished and try to click reset, then click init in the CAL MANAGER to retrieve and use the correct constants. If you are unsure, you can check the database backend for the latest injected constants and verify these are the ones you expect.
- do the detector operating conditions match what is set in the CAL MANAGER device. This can quite frequently occur if operators have changed AGIPD operation scenarios from 1.1 MHz to e.g. 4.5 MHz or change the number of memory cells. click verify config on the karabo scene if available, which will check the table with the detector middle layer and generate the verification result on the CAL MANAGER status. If this button is not presence then ask if detector operations has recently been changed, and then adjust the settings as described in Calibration Parameters are not loaded.
Pipeline Initialized but no Image Updates on the GUI
If all (expected) constants loaded, but pushing data through the pipeline does not result in corrected data being displayed, check the following:
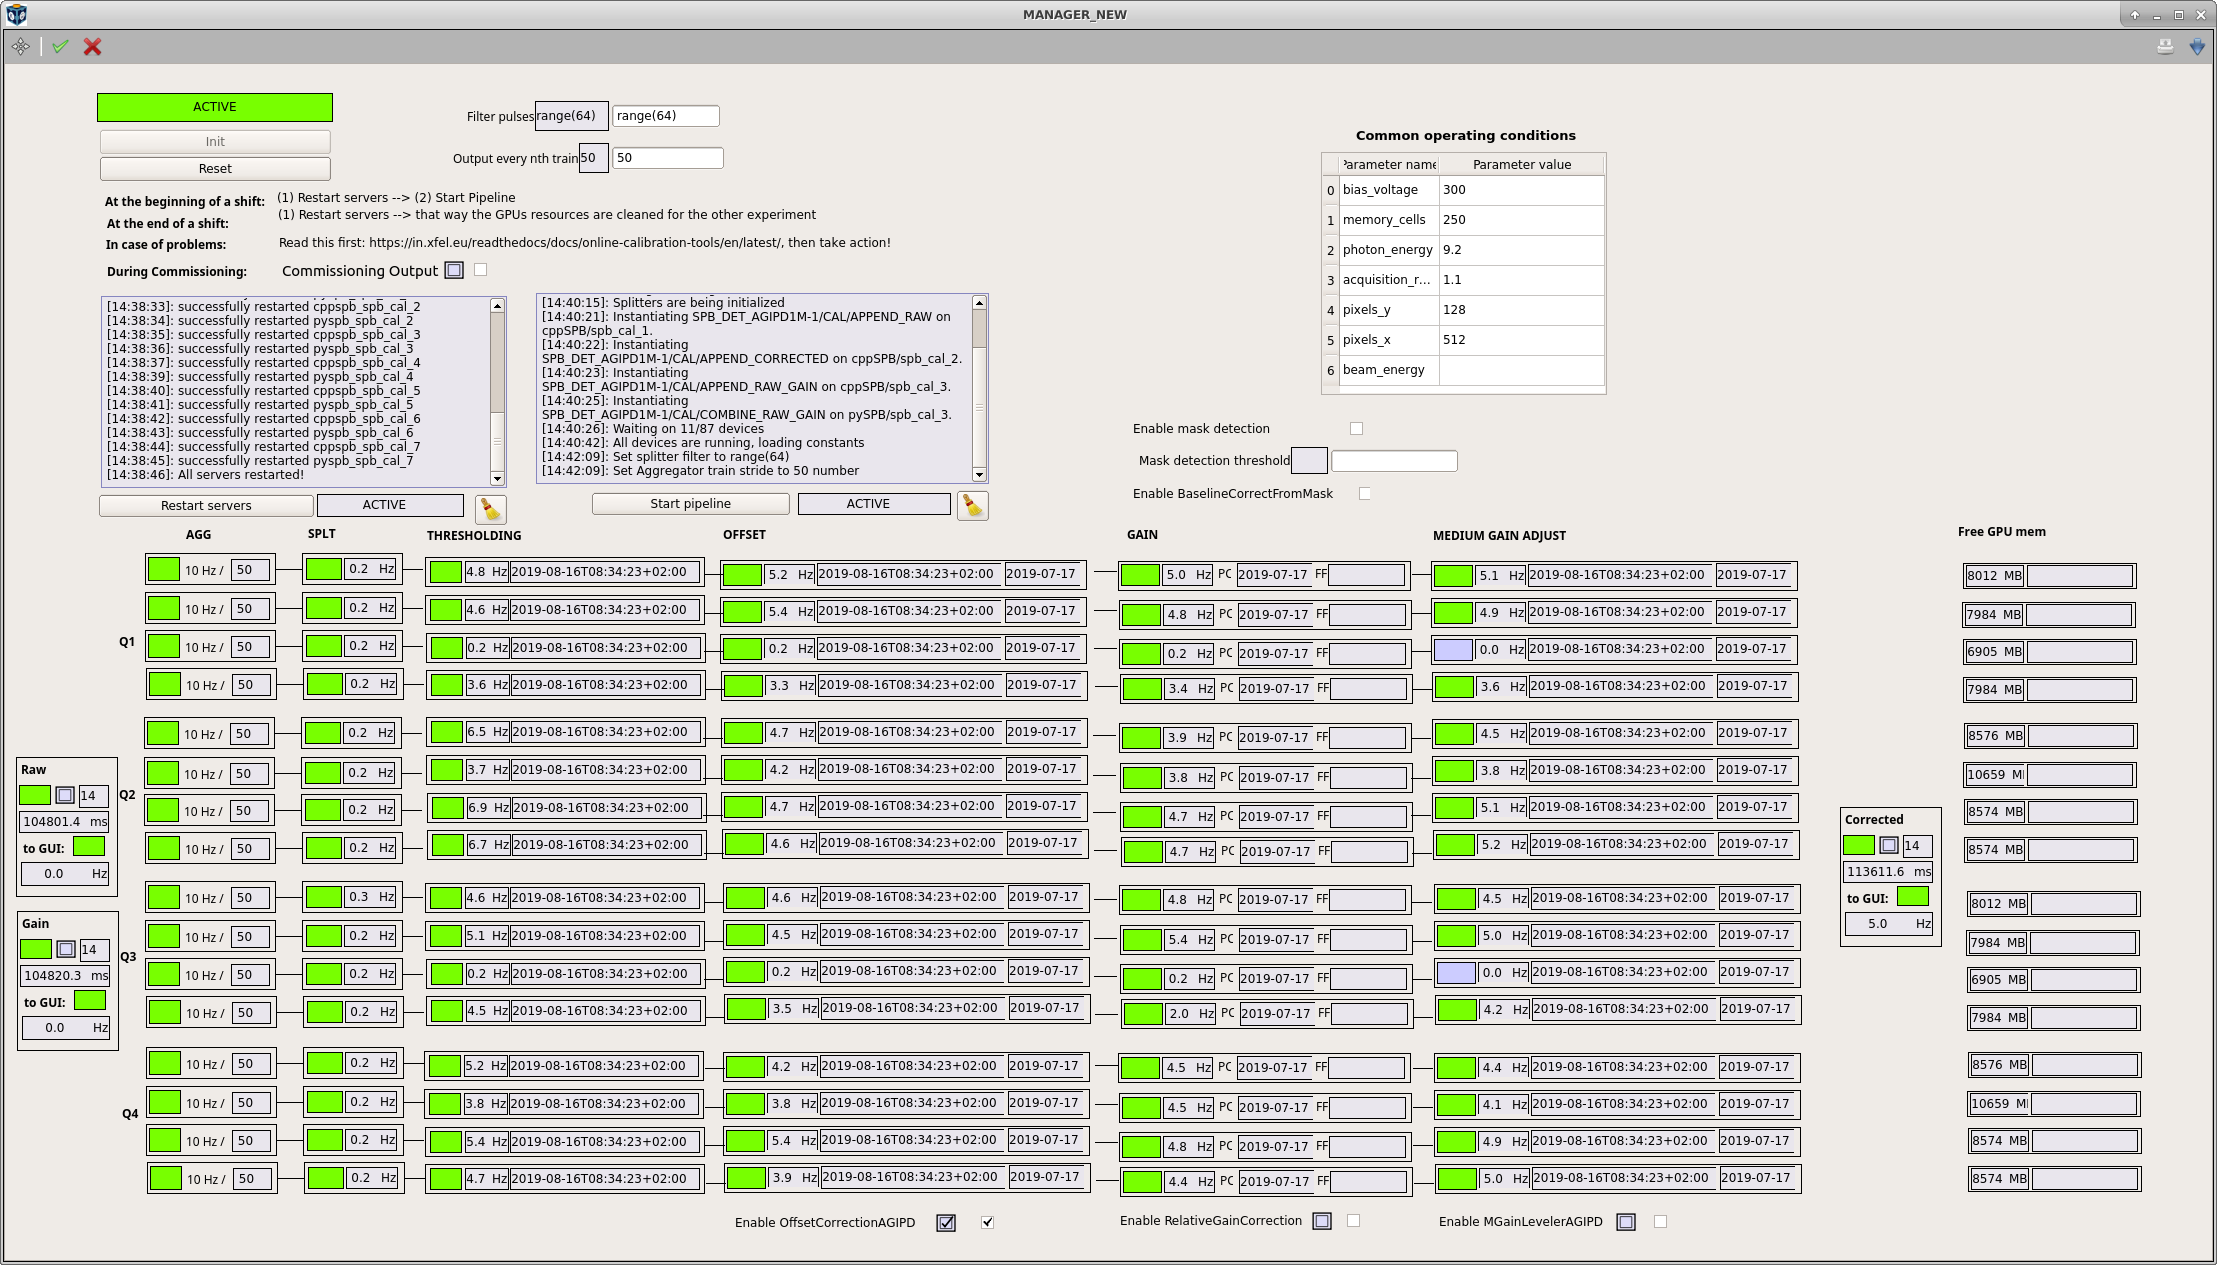
on the CAL MANAGER scene (see Fig. 18) is the RAW appender updating, are all splitter input rates updating according to the Output every nth train setting? If so, data is entering the pipeline and something went wrong on initialization. Perform the check mentioned above. If there are no updates, check that the DAQ is in monitoring/acquiring state and that the proper data sources are selected, try again. Follow general DAQ trouble shooting instruction (General Detector DAQ Troubleshooting).
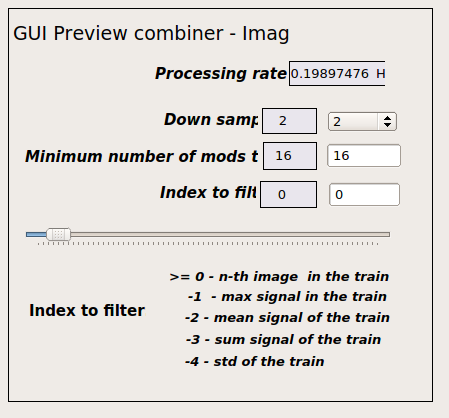
If you see updates on the splitters but no updated images, in the RAW appender, go to the RAW OVERVIEW scene and reduce the minimum number of modules required for forwarding data.

Fig. 17 APPENDER setting for online previews.
If some modules are updating, but others are not pushing data into the pipeline. Check if the respective DAQ aggregators are in an error state and call ITDM OCD in case this is the issue. If the DAQ looks fine, use the run-deck tool to verify these modules are sending data. Troubleshoot the detector if not.
In case you want to continue with a reduced number of modules, make sure the CORRECTED appender is also set to reflect this through setting parameter “min-modules=available number of modules”.
the RAW appender is updating but the CORRECTED appender is not updating for an AGIPD detector, right after a pipeline restart. The MEDIUM GAIN ADJUST are not in the ACTIVE (green) state.
This is normal. These devices need to first calculate some parameters, which can take up to a minute after first pushing data. It is important that all devices left of them have switched to ACTIVE. If this is the case, simply wait. If not, troubleshoot as above.
the APPENDER rates are updating, but the images are not. This is likely then a GUI connection problem. Try a different GUI server and call CAS OCD.

Fig. 18 Calibration pipeline overview scene of AGIPD. Other detectors look similar.
Pipeline is slow
In general the pipeline has been shown to handle up to 256 images/s in various settings with about 2000ms latency for corrected data. A conservative always safe setting are train rate and pulse filter numbers which multiply to 128 images/s. This should give about 1500ms latency for corrected data. If this is not achieved check the following:
the the output “every nth train” setting correct. It defaults to 50 on a restart and once the pipeline is initialized should be set to 10.
Is the pulse filter setting correct. It accepts range expressions, but also lists. To increase useful data, e.g. in an alternating pulse pattern, add those data indices you would like forwarded to it, e.g. “0,2,4,5,6”, or use an range with stride, e.g. “range(0,250,2)”.
If too aggressive settings have been chose, the pipeline updates will decouple and train matching rarely occurs at the final APPENDER. This can be identified by the following:
- the latency of the APPENDER devices starts piling up or varying greatly
- the update rates of pipeline components do not match the rate at the SPLITTER anymore, or have large variations.
In either case, the pipeline should recover after a few seconds of streaming data with known safe settings, e.g. outputting every 10th train, and a filter of range(128).

Fig. 19 Performance relevant settings on the manager scene.
- If a user wants single module data with low latency, you can connect to a singular modules data stream directly. There is a procedure here: Connecting a Single Module’s Raw Data to the Bridge.