2. Online Analysis
Broadly speaking, there are four ways to analyse data in real-time:
Each of them have different tradeoffs when it comes to usability and flexibility. Karabo scenes and EXtra-foam are designed to be easy to use, but extending them can be difficult. On the other hand, EXtra-metro and writing your own tools offer the most flexibility, but it usually takes a lot more work.

Note that given enough prior notice, custom analysis code can be created in collaboration with the users and made available for European XFEL experiments.
2.1. Karabo scenes
Karabo (the control system at EuXFEL) provides a customised GUI scene that displays relevant data during an experiment. E.g. the last captured corrected-Xray image from the detector, and some crucial other parameters such as train and pulse ID, beam energy, detector position, and for pump-probe experiments the pump-probe laser state, pump-probe laser delay, etc.
Specific scenes can be developed for each experiment’s needs. An example is shown in Figure Fig. 2.1.
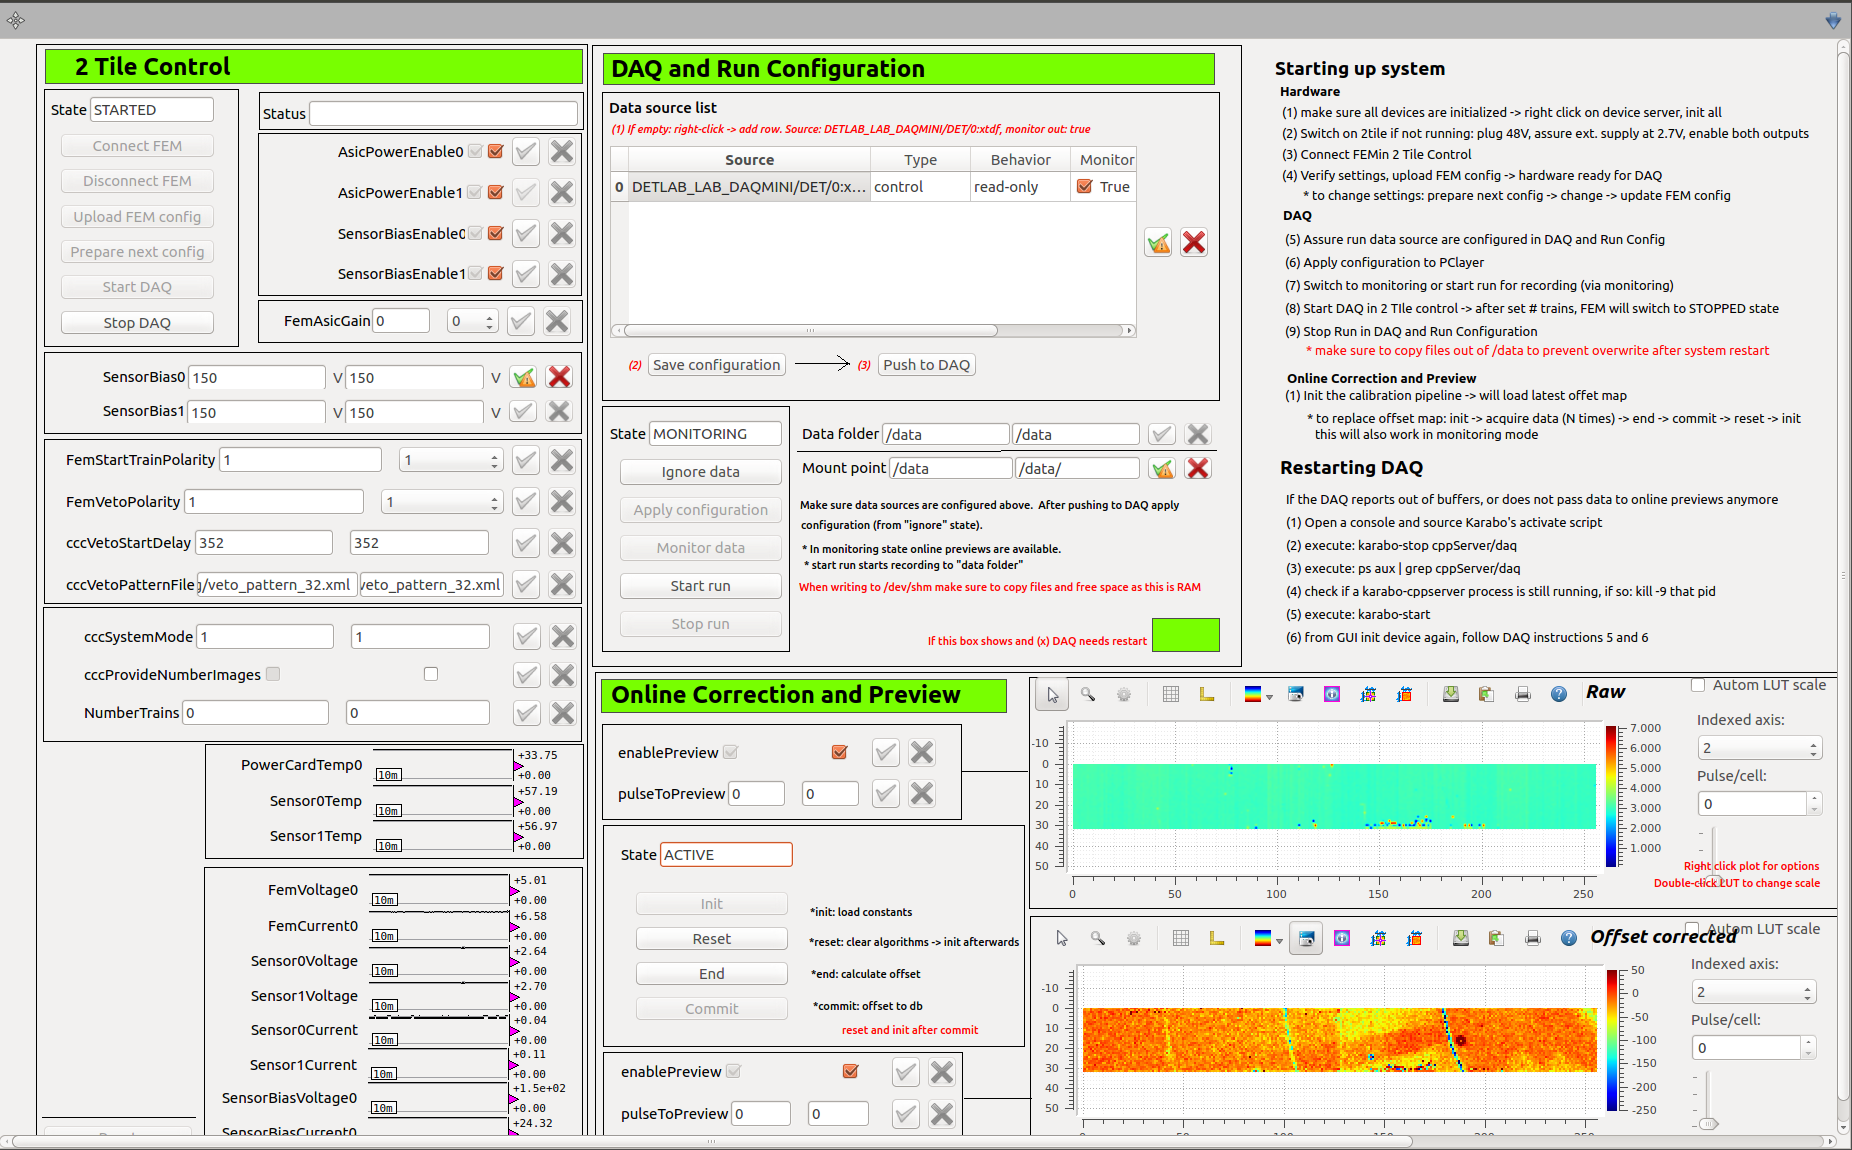
Fig. 2.1 Example of scene in Karabo for LPD detector.
2.2. EXtra-foam
EXtra-foam is a tool that provides online data analysis and visualization for experiments, primarily for 2D detectors. Some features it provides are:
Live preview of the detector. For multi-module detectors it is possible to specify the geometry for an accurate preview.
Azimuthal integration.
Analysis of ROIs on the detector, and the ability to correlate features of a ROI (e.g. intensity) with other data (e.g. time, motor position, etc).
Recording and subtracting dark images.
It works with AGIPD, LPD, JUNGFRAU, DSSC, ePix, and any train-resolved camera (e.g. Basler/Zyla cameras, etc).
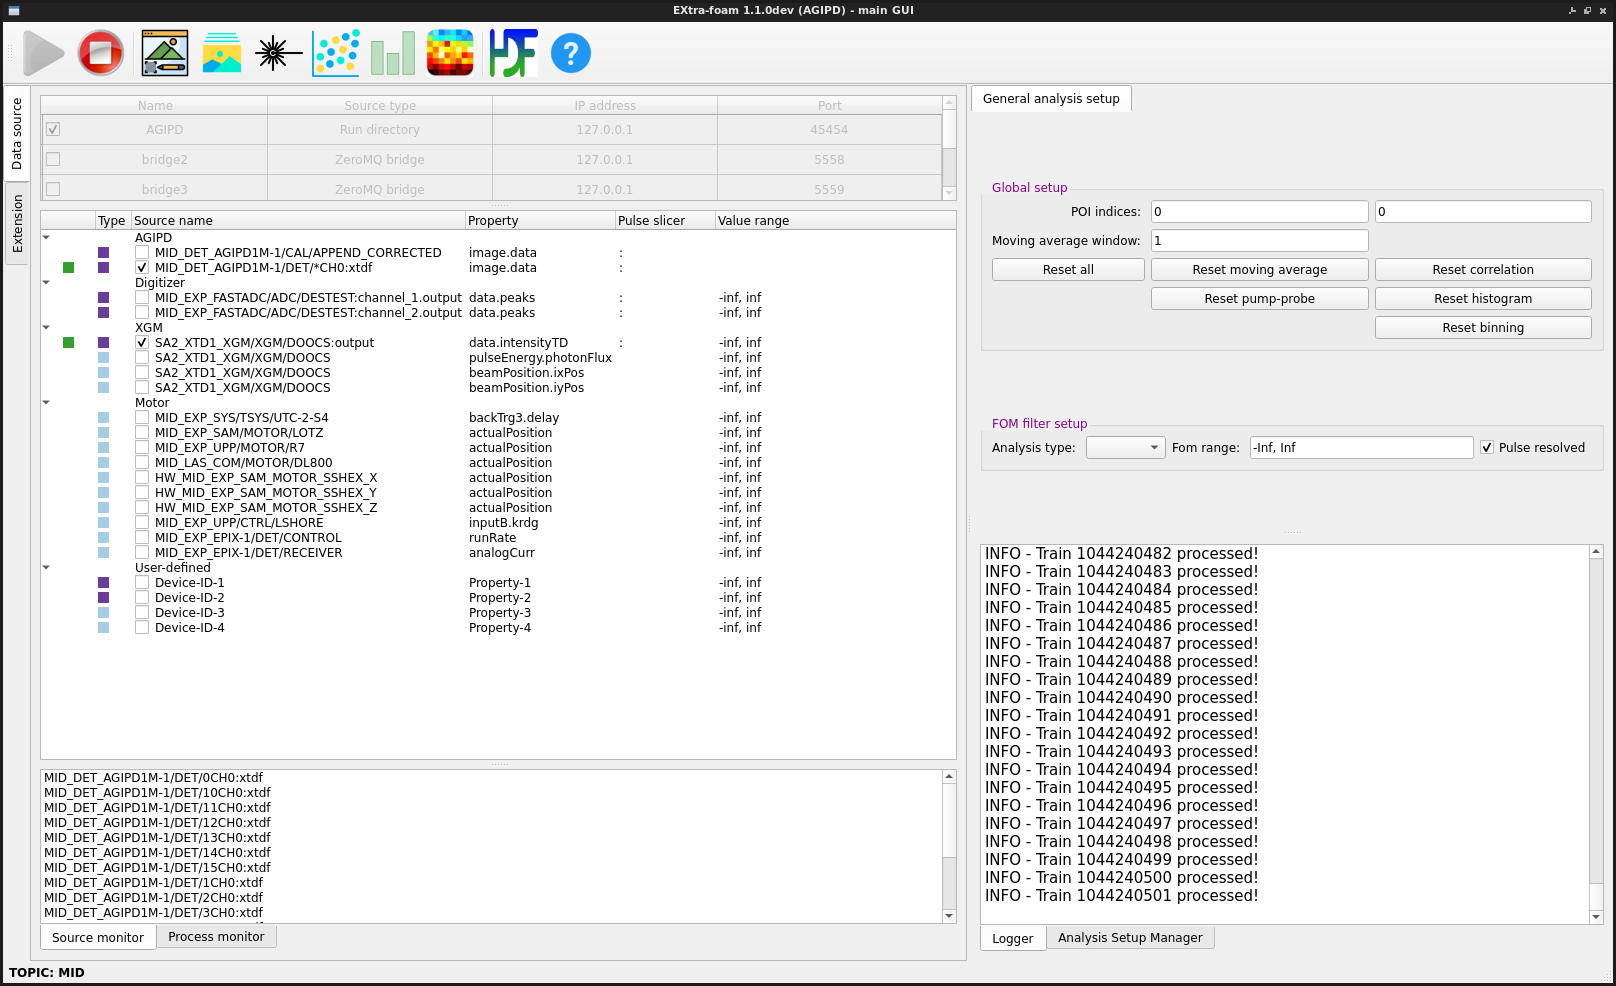
Fig. 2.2 The main window of EXtra-foam, where different data sources can be selected for processing.
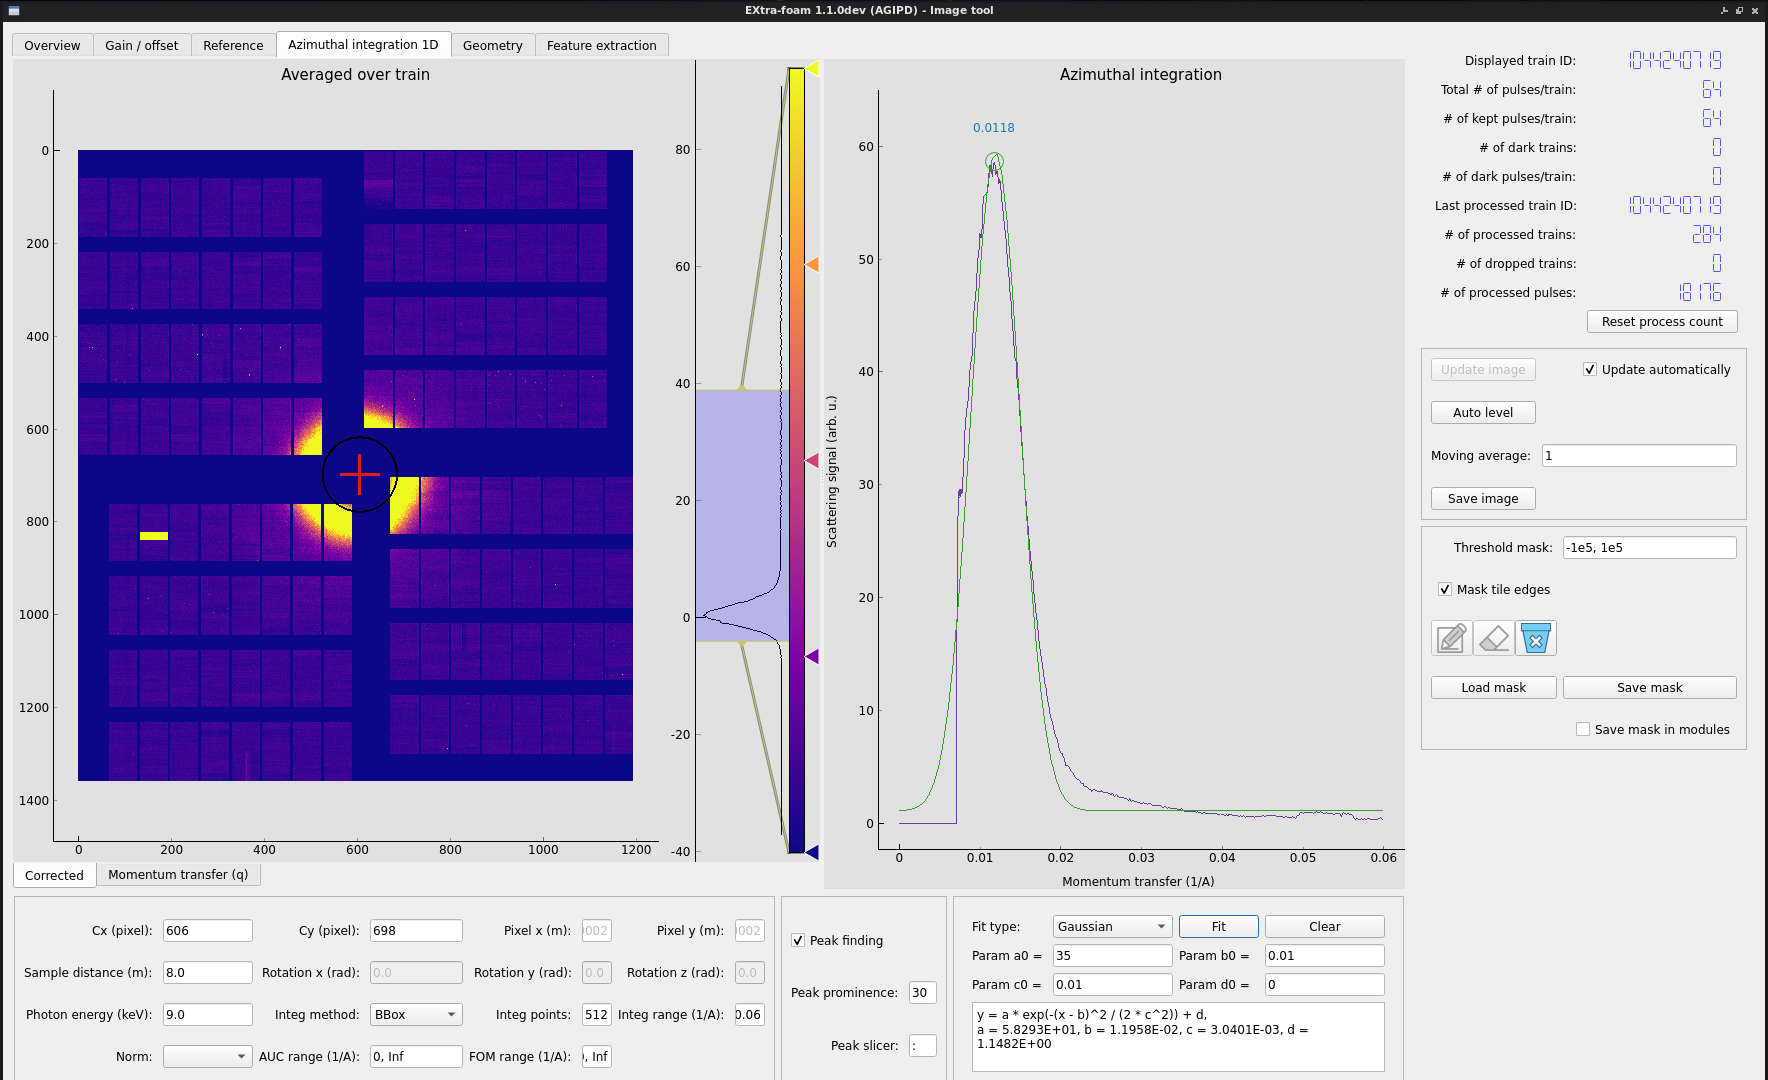
Fig. 2.3 Example of computing and fitting the \(I(q)\) curve.
In addition to the main program, there are separate programs called special suites that implement more specialized analysis for different experiments or instruments.
See also
The EXtra-foam documentation has more details on its features.
EXtra-foam was designed for doing very well-defined kinds of analysis, so in some cases it’s quite inflexible. If more flexibility is needed for an experiment, EXtra-metro is an option.
2.3. EXtra-metro
EXtra-metro is a processing framework designed to let you implement your own analysis. For example, let’s say that you want to select an ROI from a camera and apply some smoothing to it:
from scipy.ndimage import gaussian_filter

@View.Image
def smoothed_roi(camera: "karabo#SQS_ILH_LAS/CAM/BS_CAM_TT_OU1:output[data.image.pixels]"):
    roi = camera[350:750, 1000:1500]
    return gaussian_filter(roi, sigma=5)
Here we’ve defined a function which takes in an ndarray of image data from a
camera. It selects an ROI from the image, smooths it using a Gaussian filter
from scipy, and returns the result. The function is decorated with
@View.Image, which is a decorator that tells EXtra-metro that this function
is a ‘view’ into some data, and it should be visualized as an image.
If this loaded into a program that embeds EXtra-metro and data is streamed to it, this function will be executed by EXtra-metro for each train and the results will be streamed out for visualization. For example, EXtra-foam embeds EXtra-metro in a special suite and if you run the above code you might see something like this:
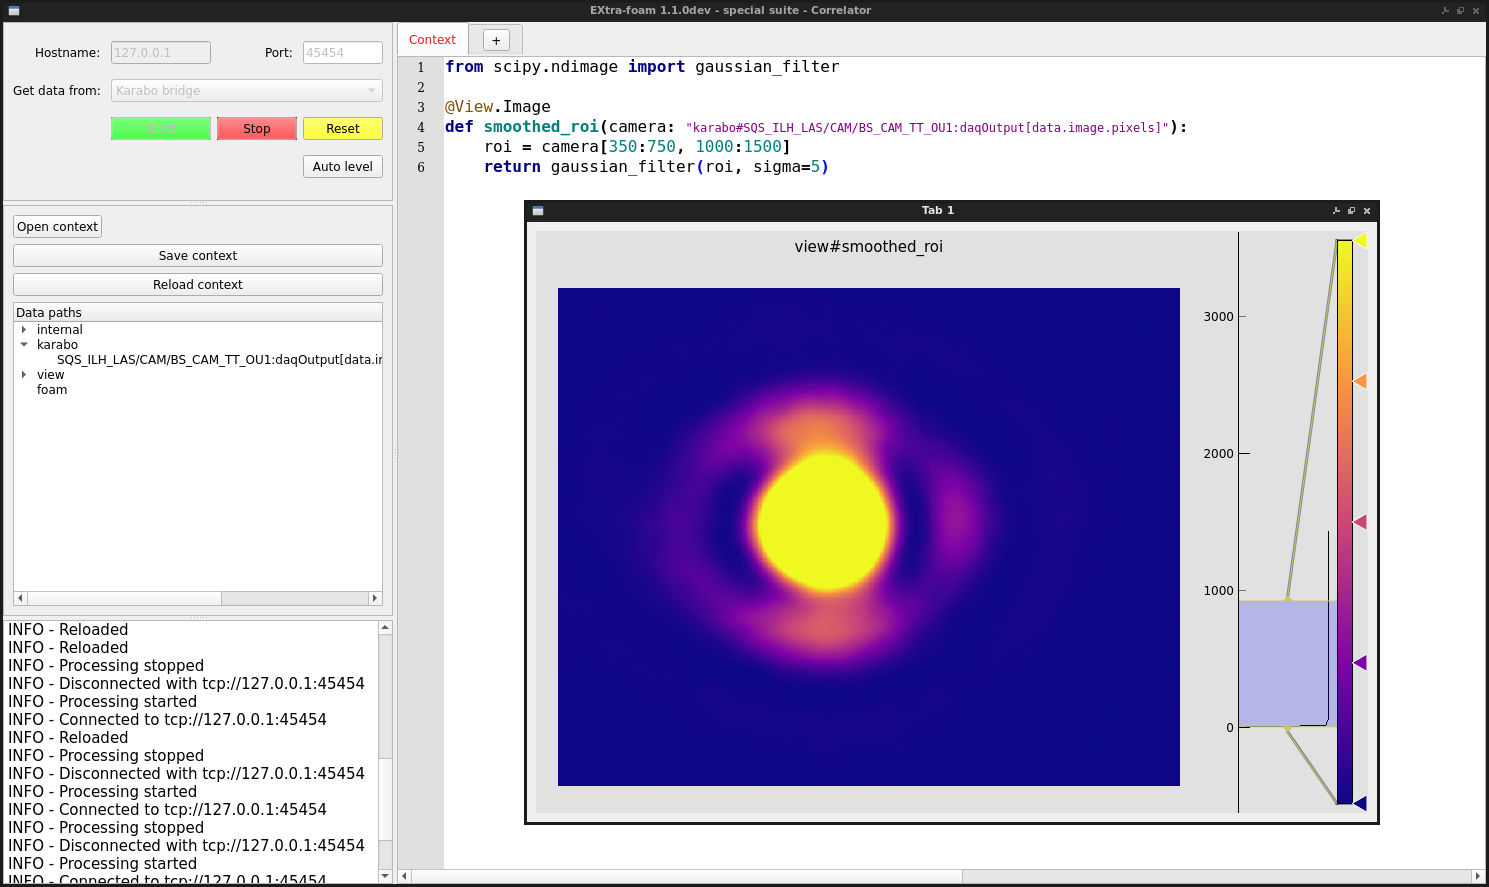
Fig. 2.4 Example of online analysis using EXtra-metro.
If you want to modify the analysis, such as tweak the sigma factor or add
another View, it’s possible to modify the code and reload it
on-the-fly. This makes EXtra-metro excellent for anything that requires a lot of
flexibility.
EXtra-metro has also been integrated with Karabo, so it’s possible to create scenes with plots and parameters to control analysis code.
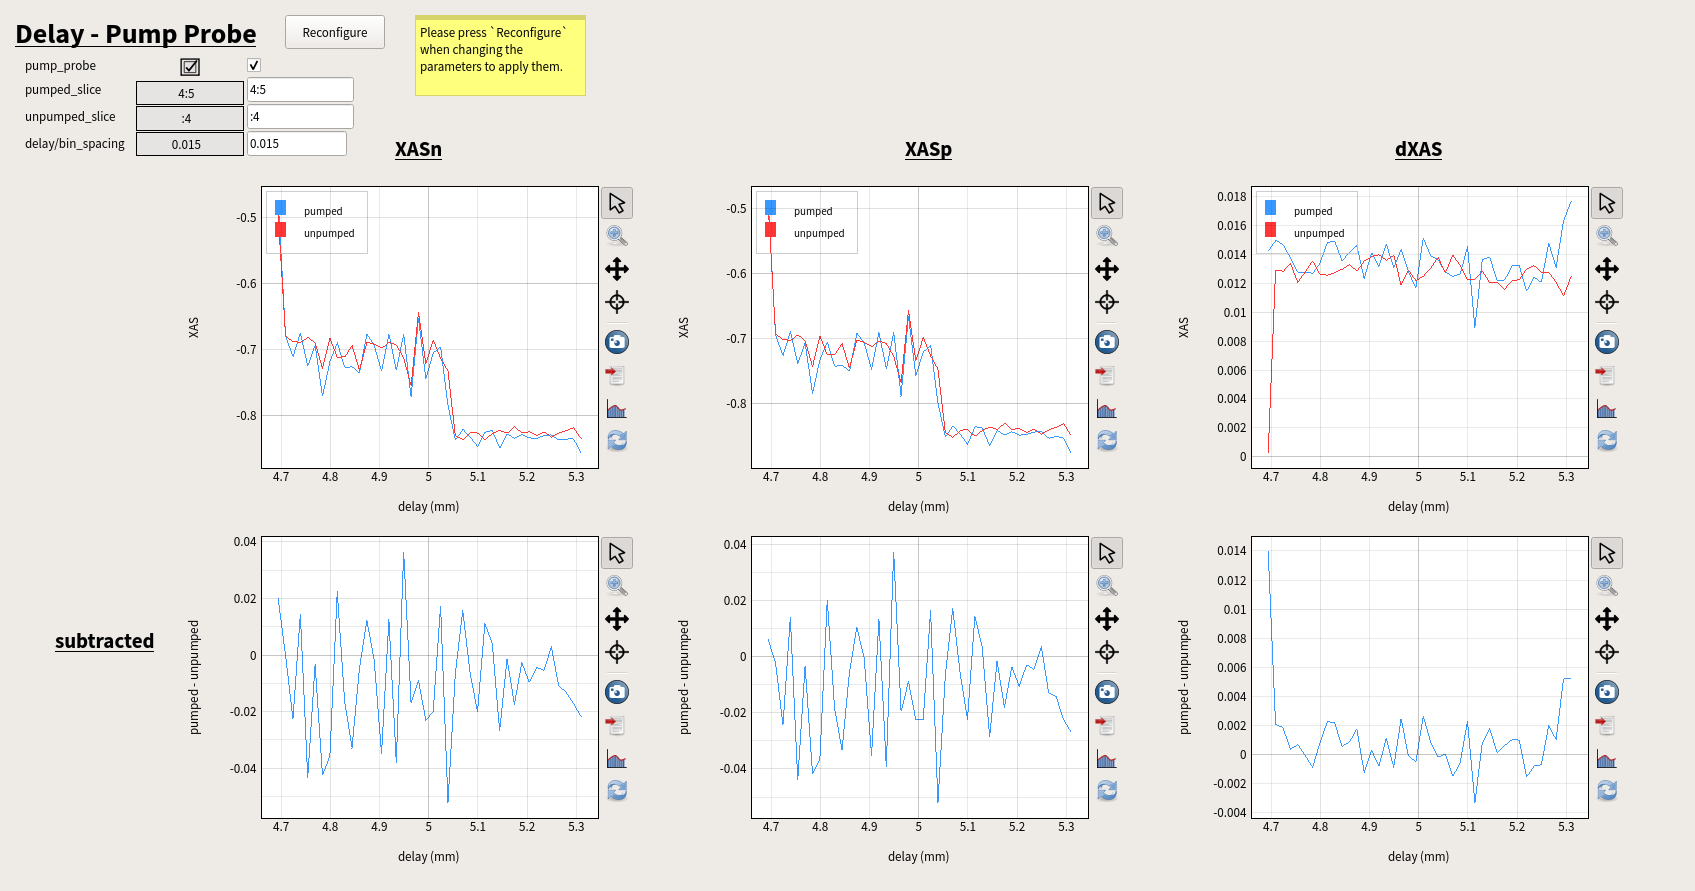
Fig. 2.5 A scene with analysis implemented in EXtra-metro, but controlled and visualized through a custom Karabo scene.
See also
Check out the EXtra-metro documentation for more information on how to write analysis code, and the MetroProcessor documentation for information on the integration with Karabo.
2.4. Streaming from Karabo bridge
A Karabo bridge is a proxy interface to stream data to tools that are not integrated into the Karabo framework. It can be configured to provide any detector or control data. This interface is primarily for online data analysis (near real-time), but the extra_data Python package can also stream data from files using the same protocol, which may be useful for testing.
We provide Karabo Bridge Clients to receive this data in Python and C++, but you can also write your own code to receive the data if necessary. A custom client will need to implement the Karabo Bridge protocol.
Any user tool will need to be running on the Online cluster to access the Karabo bridge devices that are streaming data. Some instruments already have bridges running and configured for sending detector data, but if not it is possible to set them up. Please tell your contact person at the instrument if you will be bringing custom tools that require a bridge.
Note
Data from MHz detectors at the EuXFEL (AGIPD, LPD, DSSC) might have a different data shape in file and in data streams. For each train data the shape in file follows: (pulse index, slow scan axis, fast scan axis). For performance constraints, the default shape offered for this data via data stream is: (module number, fast scan, slow scan, pulse index). This configuration can be changed on demand during beamtime and be switched between 2 shapes:
online: (module number, fast scan, slow scan, pulse index)
file-like: (pulse index, module number, slow scan, fast scan)
If you wish to use one or the other, communicate it to your contact person at the instrument.
Having file-like data shape online will add delay to the data stream, you might want to avoid this option if faster feedback is important for your experiment.
2.4.1. Simulation
In order to test tools with Karabo bridge, we provide
a simulated server in the karabo_bridge Python package.
This sends nonsense data with the same structure as real data.
To start a server, run the command:
karabo-bridge-server-sim 4545
The number (4545) must be an unused local TCP port above 1024.