6. Data analysis software
6.1. Software to access and inspect data
6.1.1. EXtra Data
extra_data is a Python library for accessing and working with data produced
at European XFEL. It can:
Conveniently access data from an experimental run, which is often spread across dozens of ‘sequence’ files.
Read data into pandas and xarray, two popular Python libraries which support powerful, efficient data analysis.
Assemble image data for multi module detectors like LPD and AGIPD, using geometry files in different formats.
Stream data from files over a ZeroMQ socket. This stream of data can then be accessed using Karabo Bridge Clients clients, to test live-processing tools with data from real experiments.
See also
6.1.2. Karabo Bridge Clients
We provide client libraries in Python and C++ to receive data from the karabo bridge, allowing users to integrate their tools with the karabo framework and receive live data during an experiment run.
See also
6.1.3. HDF5 command line tools
We hope most users will be able to access data through existing tools such as EXtra Data, or by converting it to standard formats such as CXI. But if none of these options work for you, you may need to look directly at the HDF5 files.
Basic HDF5 command line tools are available by default:
h52gif         h5copy         h5fc-64        h5perf_serial  h5unjam
h5c++          h5debug        h5import       h5redeploy
h5c++-64       h5diff         h5jam          h5repack
h5cc           h5dump         h5ls           h5repart
h5cc-64        h5fc           h5mkgrp        h5stat
You can inspect HDF5 files in the terminal with the h5glance tool,
available in the exfel_anaconda3 module (see EXtra-xwiz).
The hdfview interactive viewer is available in the xray module
(see https://confluence.desy.de/display/MXW/hdfview). To use it, first run
module load xray.
6.2. Software with scientific purposes
6.2.1. EXtra-foam
One of our main programs for online analysis is EXtra-foam, which is a GUI program for easily doing common kinds of analysis.
6.2.2. GeoAssembler
This tool provides a tool to calibrate AGIPD detector geometry.The tool can be seen as an alternative to the calibration mode of CrysFEL’s hdfsee. The calibration can either be based on a starting geometry that needs to be refined or a completely new geometry. In the latter case the initial conditions for the geometry are defined so that all modules are 29px apart from each other and 4px gap between asics within a module.
The geometry calibration is supported by two modes of graphical user interfaces. A Qt-based and a jupyter notebook based interface.
Using the Qt-Gui
It is recommended to use this Gui application through the pre-installed path on the on- and offline cluster (See EXtra-xwiz). The command is:
geoAssembler
The following optional arguments can be set via the command line:
- -h, --help
Show help about these options
- -nb, --notebook
Do not start gui, create a notebook
- -nb_dir
Set default directory to save notebooks
- -nb_file
Set file name of the notebook
- -r <run_dir>, --run <run_dir>
The path to a run folder
- -g <geomfile>, --geometry <geomfile>
Path to a CrystFEL format geometry file
- -c <clen>, --clen <clen>
Detector distance [m]
- -e <energy>, --energy <energy>
Photon energy [eV]
- -l <min> <max>, --level <min> <max>
Display range for plotting
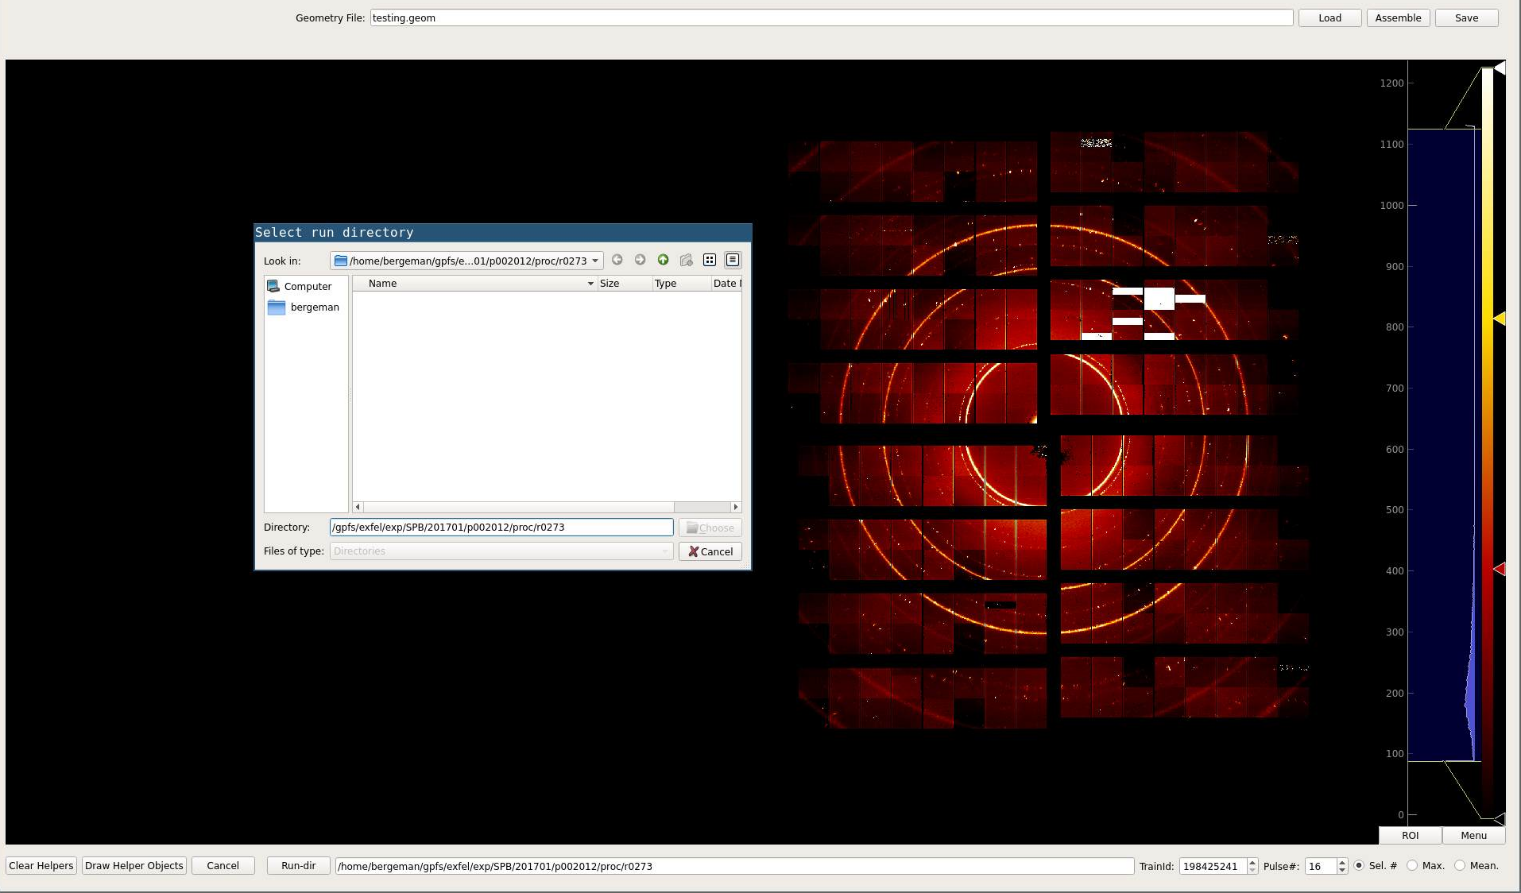
If no run directory has been preselected using the -r/--run option, a
directory can to be set by clicking the Run-dir button. Train IDs can be
selected after a run has been selected. The user can either choose to display
images by pulses or if the signal is to week/noisy by applying a Maximum or
Mean across the entire train to all images.
To do so the user can just select the Max or Mean button
instead of the default Sel #. After an image number / function has been
selected the image can be assembled using the Assemble button.
Optionally a pre-defined geometry file can be loaded using the Load button.
After the image is displayed quadrants can be selected by clicking on them. They can be moved by using the Ctrl+arrow-up/down/left/right key combination. Circles that can help to align quadrants are added by the Draw Helper Objects button. The radii of the circles an be adjusted using the radius spin box in the top left.
Once the quadrants have been positioned a geometry file can be saved by using the Save button.
Calibration Using Jupyter
The -nb, --notebook flag creates a Jupyter notebook in the home
directory. This notebook is self explanatory.
Dependencies If the user doesn’t want or cannot use the xfel module and wants to install the tool the following python packages should be available:
numpycfelpyutilspyqtgraphmatplotlibipywidgetspyqt5pyFAI
6.2.3. XasTim
A toolchain for real-time data analysis and visualization of XAS (X-ray Absorption Spectroscopy) experiments using the TIM (Transmission Intensity Monitor) device.
See XasTim in the SCS toolbox for more details.
6.2.4. Cheetah
The CFEL group at DESY provides Cheetah on the Maxwell cluster. See their documentation for how to get started using it.
6.2.5. EXtra-xwiz
A command-line tool for managing serial femtosecond crystallography (SFX) workflows using CrystFEL on EuXFEL-calibrated detector data. It is currently in a beta-testing phase.
6.3. Access on online and Maxwell cluster
The tools described above are readily available on both the online cluster and the Maxwell cluster. We recommend using the already setup applications available in the XFEL specific Anaconda3 distribution:
module load exfel exfel_anaconda3
This will provide access to all these libraries and tools for data analysis:
extra_dataEXtra-foamkarabo_bridgeextra_data_interactivegeoAssemblerpyFAIxas-tim-viewkarabo-bridge-recordkarabo-bridge-replayh5glanceextra-data-validate
There are many other applications and libraries available on the Maxwell cluster, maintained by DESY. There is a listing at: https://confluence.desy.de/display/IS/Alphabetical+List+of+Packages
Not all of this software is on the online cluster (maintained by EuXFEL).
6.4. Adding extra software
Both the Offline cluster and the Online cluster
environment feature a set of data analysis tools. If an experiment
requires access to additional analysis packages or applications, this
user requirement should be discussed and agreed ahead of the experiment;
please contact da-support@xfel.eu in such a case.
In addition, users can bring their own tools and install them in their user space. This will make them available for immediate use in both offline and online environment.
6.5. Make your software available to all users at EuXFEL
In general, users who create their own data analysis packages are encouraged to share the progress on such data analysis development with European XFEL and seek help to make them functional at EuXFEL.
EuXFEL is keen to make such existing tools available to all users, and to
provide the corresponding software as a service as part of a collaboration with
the authors of the package. Please approach da-support@xfel.eu for further
information and discussion if this is of interest to you.