The Navigation Panel
The navigation panels gives you a live view of the system, in a tree hierarchy. This is in contrast to the project panel, which presents a logical view of the system, as grouped by components.
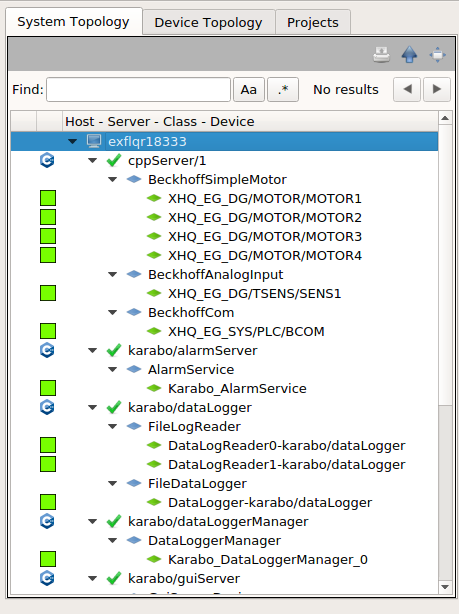
The Karabo navigation panel. Icons next to the device instance id give you the color code status of the device, as well as the alarm condition of the device if an alarm is active.
In its default view, the navigation panel shows the system topology in tree hierarchy showing the unified and alarm states of the running devices. This is automatically shown upon successfully connecting to the GUI server of the desired topic.
This is comprised of the following components, and will be further discussed on the following chapters:
Panel Bar
Search Bar
System Topology
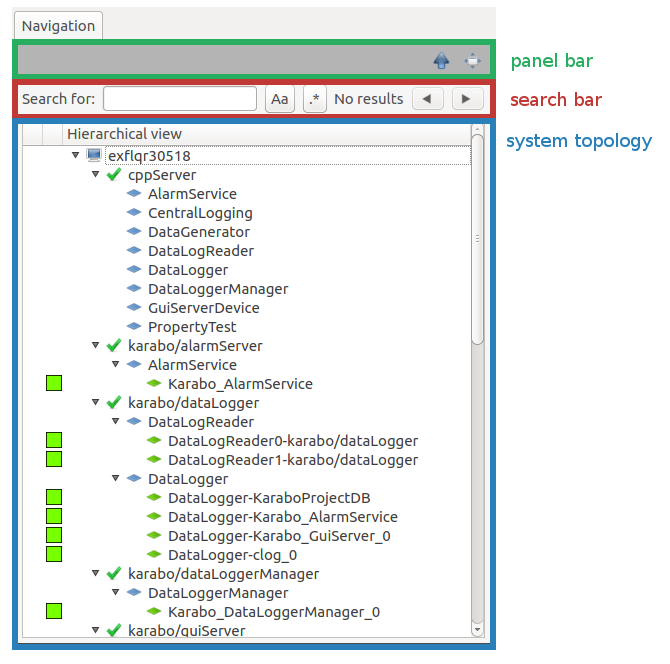
A navigation panel is composed of the panel bar, the search bar, and the
corresponding topology tree (System Topology).
System Topology
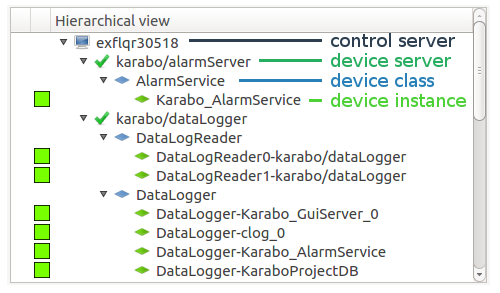
The system topology consists of Karabo components, namely: control servers, device servers, device classes and device instances.
Control servers are the physical machine running the device servers.
Device servers are the hosts of devices.
Device classes are the templates of devices.
Device instances are running devices on the device server.
These components are show in a tree structure:
control_server
├── device_server
    ├── device_class
        ├── device_instance
and can be seen in the Navigation Panel as follows:
 Control Server
The control server is a machine or computer that hosts Karabo components,
namely device servers, devices, clusters of brokers, and database servers. This
usually has a name exfl_____. A system could have one or more control servers.
 Device Server
Device servers are the hosts for Karabo devices. They are responsible for loading the device code and running the device in an event loop, i.e. keeping it live and available to the distributed system. Device servers come in three flavors: C++, Python and middle-layer device servers.
Context menu
Right-clicking will show a context menu, which are as follows:
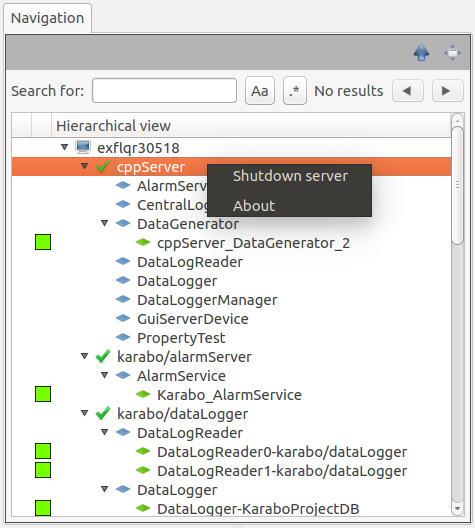
The server context menu.
Shutdown server
This will restart the server, which takes a few seconds. When this option is selected, the server will be removed in the system topology but will then restart and reappear after the last server of the same control server.
About
This will show a dialog that contains keys which describes the device server.
About
The contents of About varies for different servers classes, which can be seen as follows:
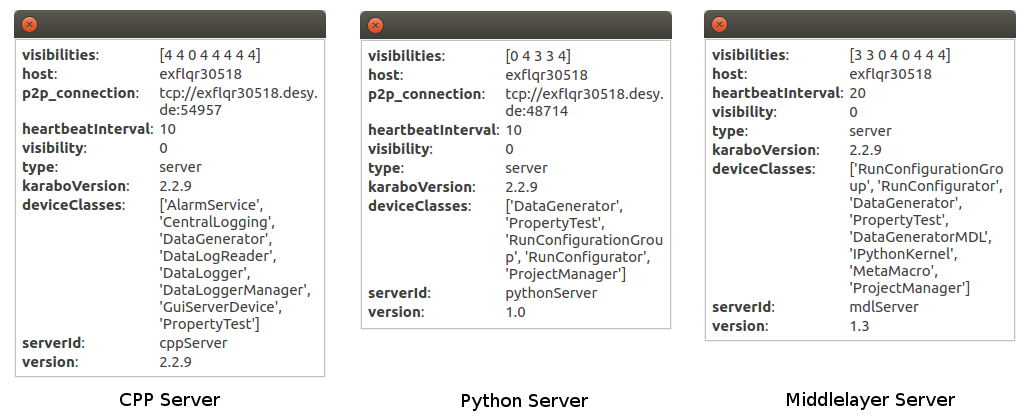
The About dialog of the different device server classes.
Below is a more detailed information about each keys.
key |
type |
description |
|---|---|---|
|
string |
Karabo component type: host: control serverserver: device serverclass: device classdevice: device instance |
|
string |
The ID of the device server. |
|
string |
The version of the device server. |
|
string |
The ID of the control server where the server is located. |
|
integer |
User access level who can see the server: 0: observer (default)1: user2: operator3: expert4: admin5: god |
|
integer |
Interval in seconds at which the server sends heartbeats to distributed systems |
|
string |
Current version of the Karabo Framework. |
|
string |
Complete address of the host ( |
|
vector string |
List of devices classes that can be instantiated in the server. |
|
vector integer |
List of visibility of the device classes. |
 Device Class
Device classes that can be run on the device server are shown at its children
in the System Topology. They appear in the topology when a device of the
respective class is online.
The list of available classes can be viewed via the server’s About.
The device classes are also listed in the server’s About dialog.
Configuration
Clicking the device class will show the default device Schema in the
Configuration Panel.
The default device class configuration will be shown when clicking the device class in the Project Panel.
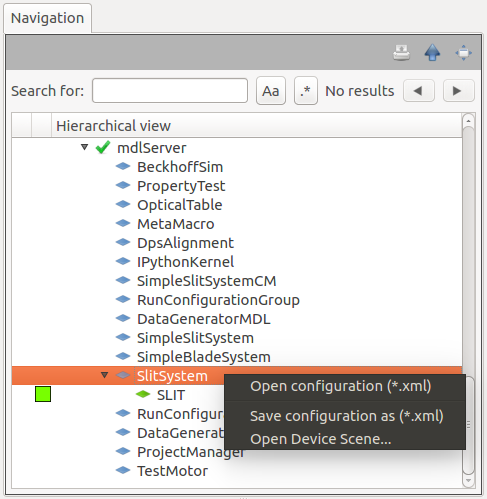
Context menu
Right-clicking will show a context menu, which are as follows:
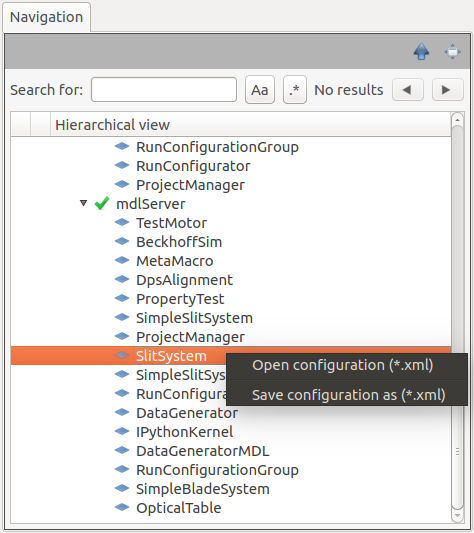
The device class context menu.
Open configuration (*.xml)
This will load a device class configuration file.
Save configuration as (*.xml)
This will save the current device class configuration as an
.xml.
See also
Configuration Panel.
Open device scene
This option will only appear when a device class has been instantiated for the session and if it has a default scene. If selected, the default scene for the device will be shown on the Scene Panel. The retrieved scene from a navigation panel will not be attached to the project.
See also
Scene Panel.
 Device Instance
When a device is successfully instantiated, it goes online and runs on the specified device server. A device instance is shown under the device class of the device server that hosts it. Its status can easily be perceived in the Navigation Panel with the help of some visual indications.
Instance status
The device instance icons change depending on its status.
icon |
status |
description |
|---|---|---|
|
Instantiated |
The device is instantiated and is healthy. |
|
Instance Error |
The device is instantiated but has encountered error(s) |
|
Monitored |
The device is instantiated and its configuration is being monitored via the scene or configuration panel. |

Alarm levels
The alarm level of device instances can be seen in the first column of the system topology. This appears when one of its properties trigger an alarm. Below are the alarm indications and their meanings.
icon |
status |
description |
|---|---|---|
None |
The device is working normally. |
|
|
Warning |
A device property is in a value range where it should be monitored. |
|
Critical |
A device property is in its critical value range. |
|
Interlock |
A device property has triggered an interlock. |


Device status
The device status can also be perceived from the status icons that appear on the second column of the system topology.
icon |
status |
description |
|---|---|---|
|
error |
Hardware and/or pipeline-processing error(s) has been encountered. |
|
ok |
The device did not encounter any errors |


Configuration
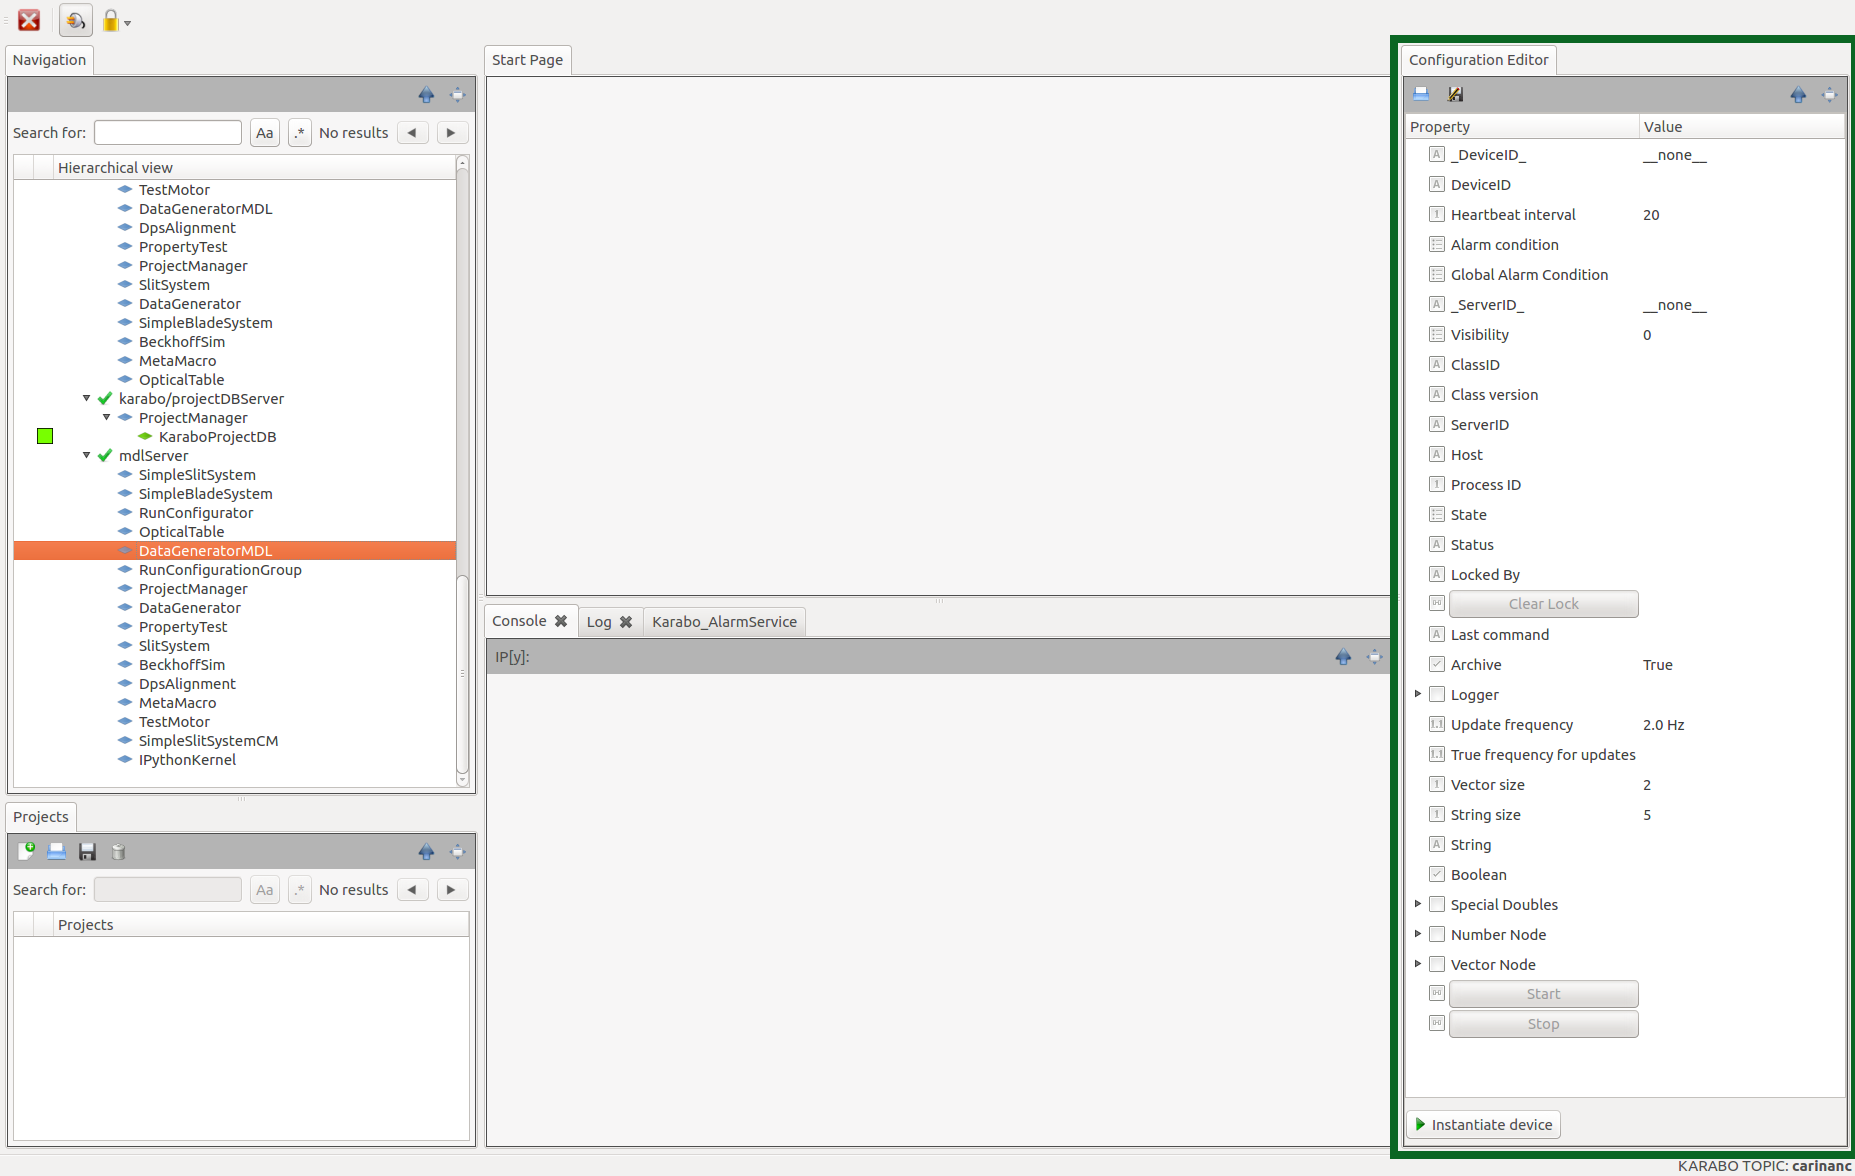
Clicking the device instance will show the current device instance configuration in the Configuration Panel.
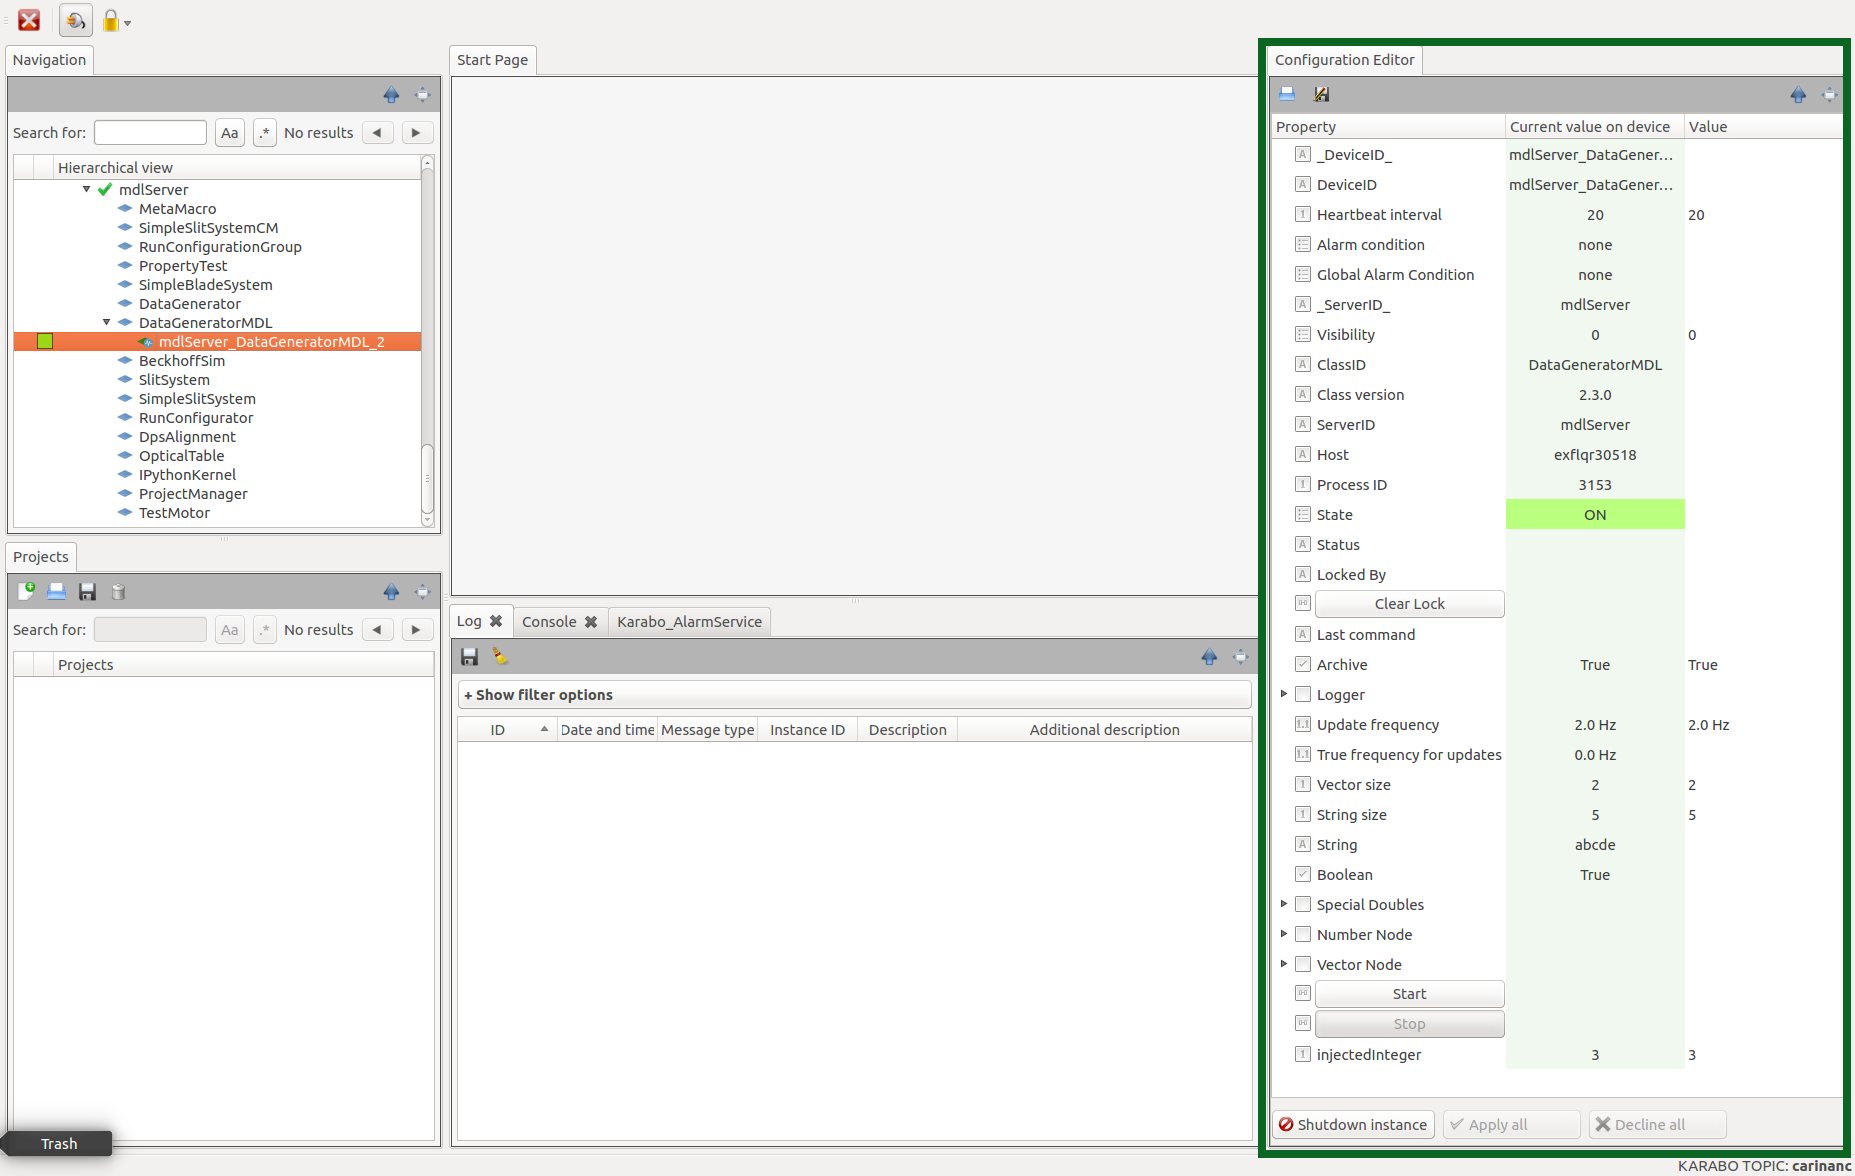
The instance of the new device configuration.
This will also change its icon to  , denoting
that it is the current device configuration shown in the Configuration Panel.
, denoting
that it is the current device configuration shown in the Configuration Panel.
Context menu
Right-clicking will show a context menu, which are as follows:
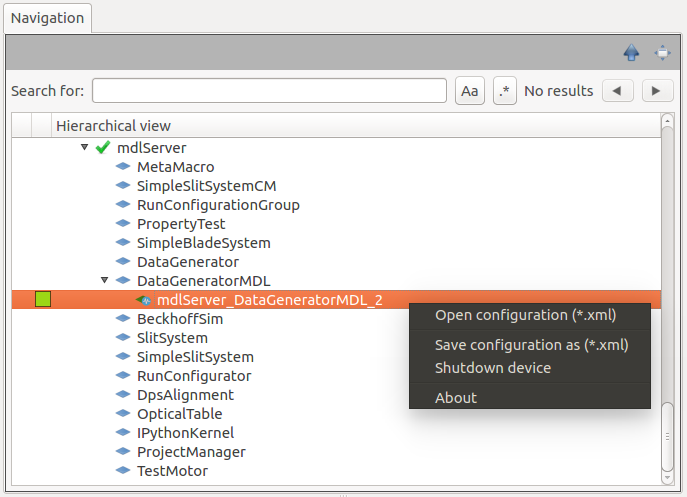
The context menu of the device instance.
Open configuration (*.xml)
This will load a device class configuration file.
Save configuration as (*.xml)
This will save the current device class configuration as an
.xml.
Shutdown device
This will shutdown the device instance and remove it from the system.
Open device scene
This option will only appear for devices with available scenes. If selected, a dialog where the scene to be displayed can be selected.
About
This will show a dialog that contains keys which describes the device instance.
Opening Default Device Scene
Aside from displaying scenes from the context menu option, the default device scene can also be opened by double-clicking the device instance.
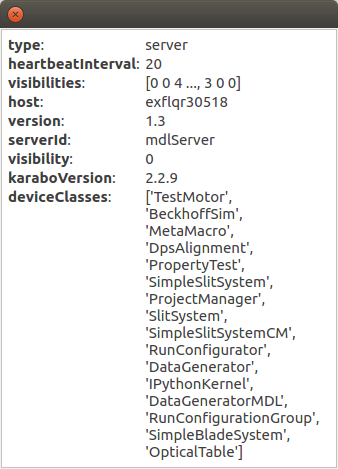
About
The contents of About varies for different instance classes, which can be seen as follows:
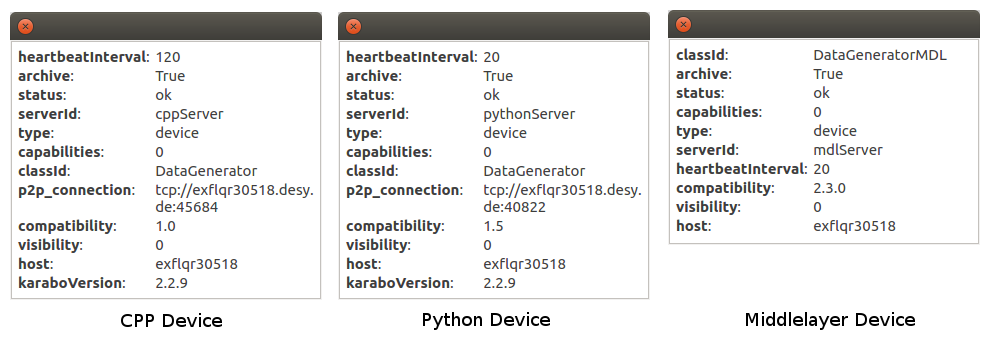
The About dialog of the different device instance classes.
Below is a more detailed information about each keys.
key |
type |
description |
|---|---|---|
|
integer |
Interval in seconds at which the server sends heartbeats to distributed systems |
|
bool |
Whether the device is archived in the |
|
string |
Description of the device status. |
|
string |
The ID of device server which the device is running on: cppServerpythonServermdlServer |
|
text |
Karabo component type: host: control serverserver: device serverclass: device classdevice: device instance |
|
integer |
What the device can do, a sum of: 1: provides scenes2: provides macros4: provides interfaces |
|
string |
The ID of the device class of the instance. |
|
string |
Complete address of the host ( |
|
string |
Earliest version of Karabo Framework the device is compatible with. |
|
integer |
User access level who can see the device: 0: observer (default)1: user2: operator3: expert4: admin5: god |
|
string |
The ID of the control server where the device is running on. |
|
string |
Current version of the Karabo Framework |
Expanding/collapsing the tree
The system topology is expanded by default. This means all items are being shown in the Navigation Panel, resulting to a lengthy topology. A component can be collapsed, with its members being hidden from the list. The arrow icon beside the component can be clicked in order to do so.
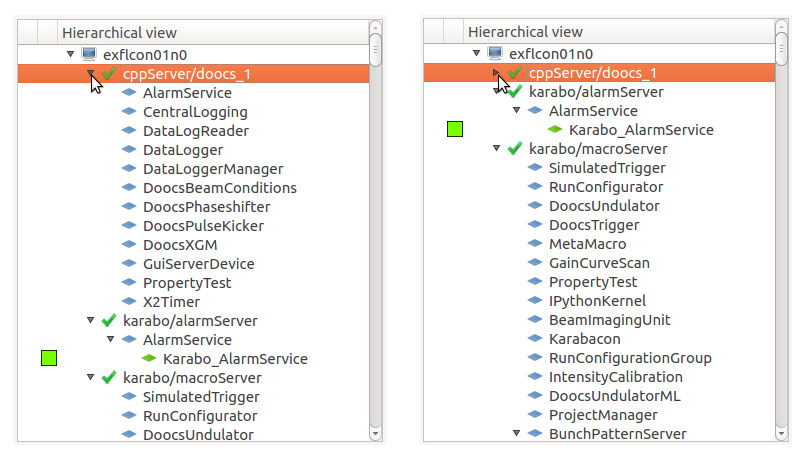
A Karabo component with members (such as cppServer/doocs_1) can be
expanded (left) and collapsed (right) by clicking on the arrow icon beside it.
The header of the system topology can also be double-clicked to expand/collapse all the components.
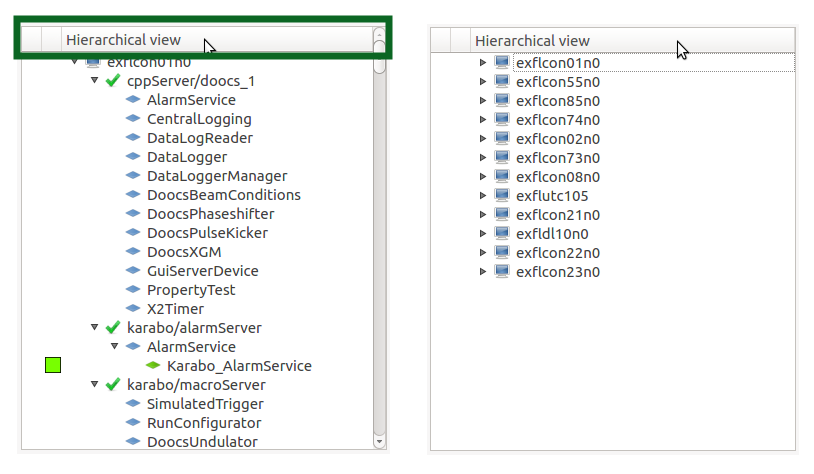
Double-clicking the header (left) will collapse the tree, leaving a list of control servers (right). Double-clicking it again will expand all the components.
Search Bar
The Search Bar enables users to find the Karabo component of their interest in the system topology. This is helpful especially with complicated topologies such as instrument topics.
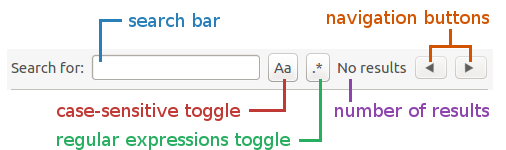
This is composed of a text field, navigation buttons, and case-sensitivity and regular expression toggle buttons.
Searching Karabo components
In order to search for a Karabo component, the user can enter its ID in the search field. The search is being done incrementally, meaning that it is being done as-you-type. The number of results are reflected on the text on the right. The first result from the top will also be highlighted.
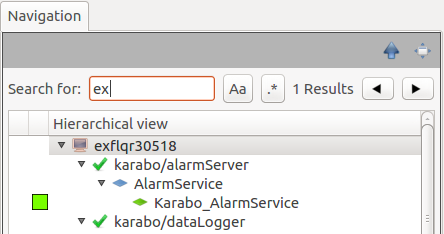
Searching for ex in the system topology returns 1 result. It hits the
control server exflqr30518.
Navigating through the results
The search results can be viewed via the navigation buttons. These buttons can be used to go to the previous or next result. When pressed, the consequent entry will be focused, therefore being highlighted and its configuration being shown in the Configuration Panel.
The navigation is done in an orderly manner, which means that the results are viewed from the top to the bottom of the topology.
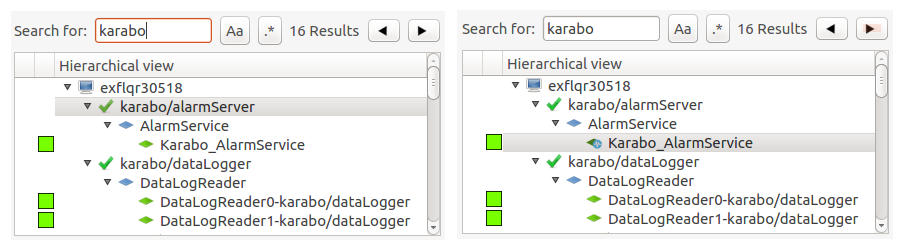
Searching for karabo will hit the first component ID from the top that
contains it, which is the device server karabo/alarmServer (left).
Clicking on the next navigation button will then hit the device instance
Karabo_AlarmService, which is the second entry from the top (right).
When the search returns no results, these buttons are disabled.

Navigation buttons are disabled when no results are found.
Case-sensitive search
The search filter is case-insensitive by default. Toggling the case-sensitive button will match the case of the input text.
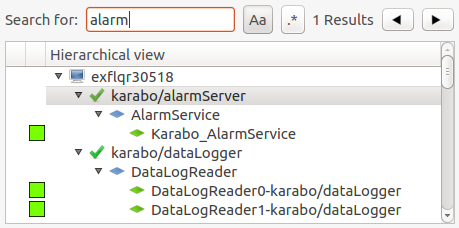
The alarm search with case-sensitivity enabled hits the
karabo/alarmServer but not AlarmService and Karabo_AlarmService.
Regular expressions
Regular expressions (regex) can also be utilized when searching. This is by toggling the regex button and entering a valid regex string.
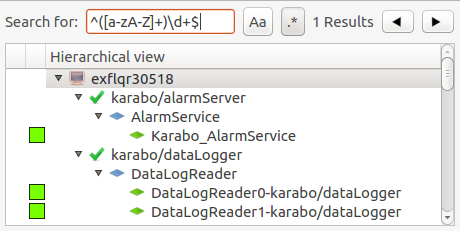
Searching for component IDs that start with letters and end with digits
can be done by the regex ^([a-zA-Z]+)\d+$. It successfully hits the
control server exflqr30518.
Note
Karabo GUI uses Python’s re module in managing the regex. Follow the link
below for more information.