The Service Panels
The service panels are available in the Menu Bar of the karabo GUI. By default, no service
panel is visible on startup. The visibility of each panel can be stored in the
local machine settings (QSettings) for the karabo GUI.
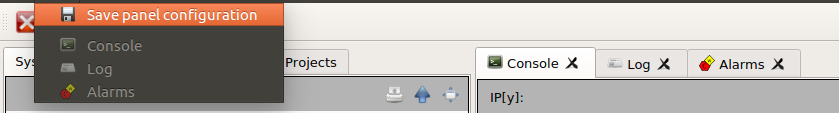
The Service Panel Overview and Configuration
Activating any service panel will show the service in the Middle Section of the karabo GUI.
Clicking Save panel configuration will store the actual visible configuration.
The Alarm Panel
Alarms are tracked by the central alarm service and can be viewed and acknowledged through the
Alarm Panel located in the middle area of the GUI. It uses the following custom panel.
icon |
status |
description |
|---|---|---|
None |
The device is working normally. |
|
|
Warning |
A device property is in a value range where it should be monitored. |
|
Critical |
A device property is in its critical value range. |
|
Interlock |
The device has a triggered interlock condition. |


In the first column of the panel the ID of the entry in the alarm service is shown, followed by
the first time of occurence and the time of occurence.
The time tracking enables the operator to estimate the severity of a long
standing warning or alarm condition.
The fourth column shows the deviceId, e.g. the device name from where the alarm was triggered from.
Afterwards, the property related to the alarm is described, it can be either a normal device property
or referred to a globalAlarmCondition, presented as global.
The Type of the severity is provided with an icon for quick visualization and identification.
If the device author provided additional text information related to this alarm, it will
be shown the description column.
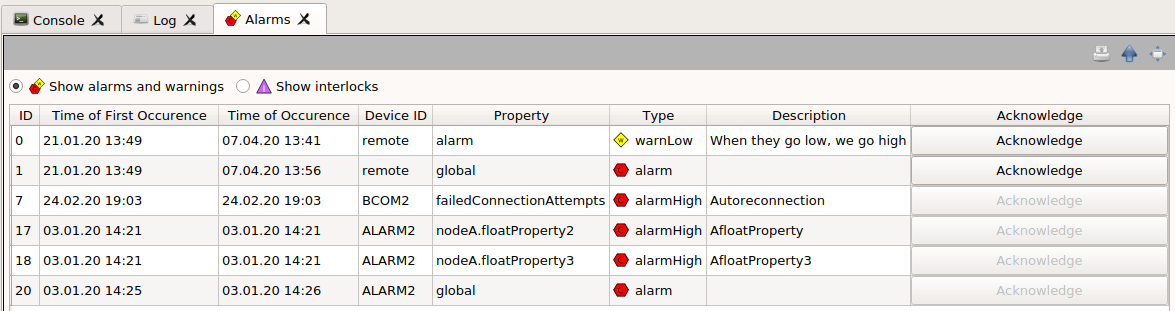
The alarm service widget.
Alarms can be further of different nature. Next to normal alarm conditions, some alarms may require an active acknowledgement in order to be deregistered from the alarm service. Acknowledgement is only possible when the device is either shutdown or the alarm condition has vanished.
Double-clicking a row in the Alarm Panel will look up the deviceId in the
Topology Panel.
The Logging Panel
The Logging Panel is an essential feature of the KaraboGUI. Depending on the
filter setting of the GUI-Server, log messages are forwarded to the Karabo
GUI Client.
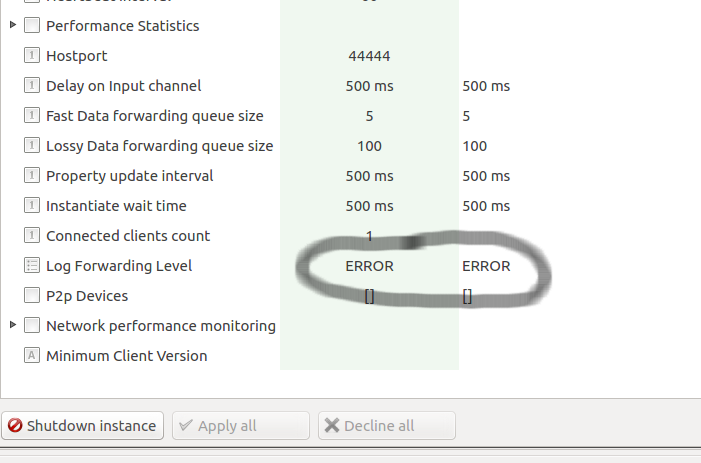
GUI Server configuration
The forwarded log level can be configured on the GUI server as shown in
the (Fig. %s).
The GUI client will receive every log message from the whole Karabo Topic,
which is why the default is set to INFO, as logging can result into a
denial of service.
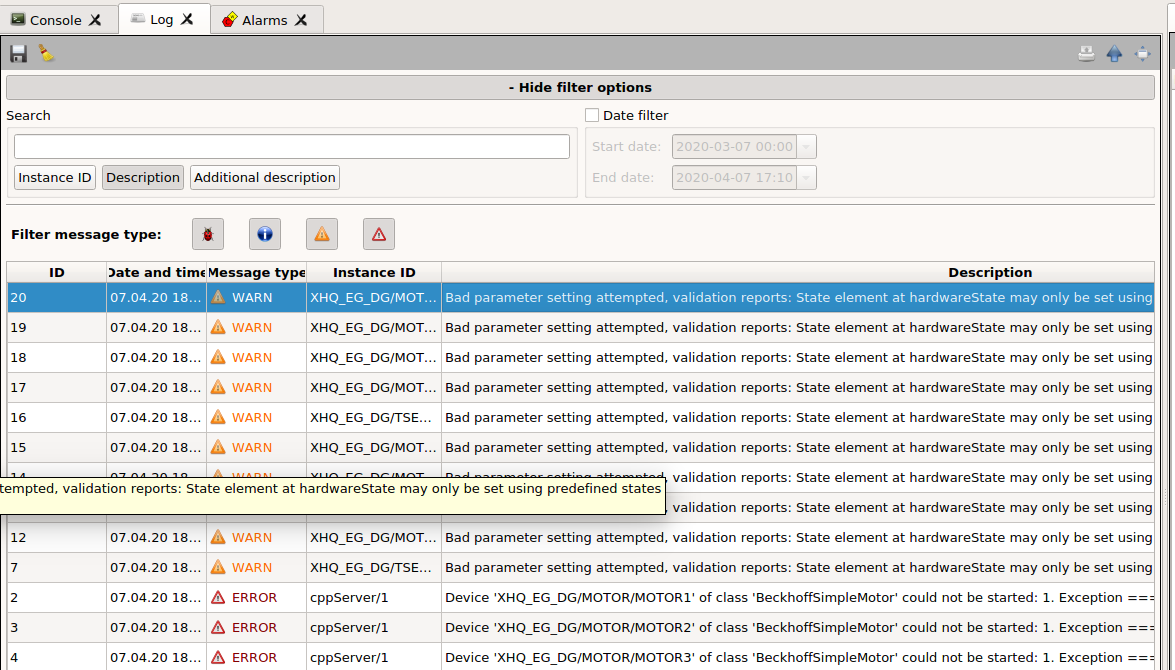
Logging Panel
Double-clicking a row in the Logging Panel will look up the deviceId in the
Topology Panel.
The Macro Panel
The Macro Panel allows the user to write Python scripts for small, recurring tasks. A macro can be created or loaded from a device via the Project Panel.
Once it has been created or loaded, just double-click it to send it to the Macro Panel, where a view similar to the following will be shown.
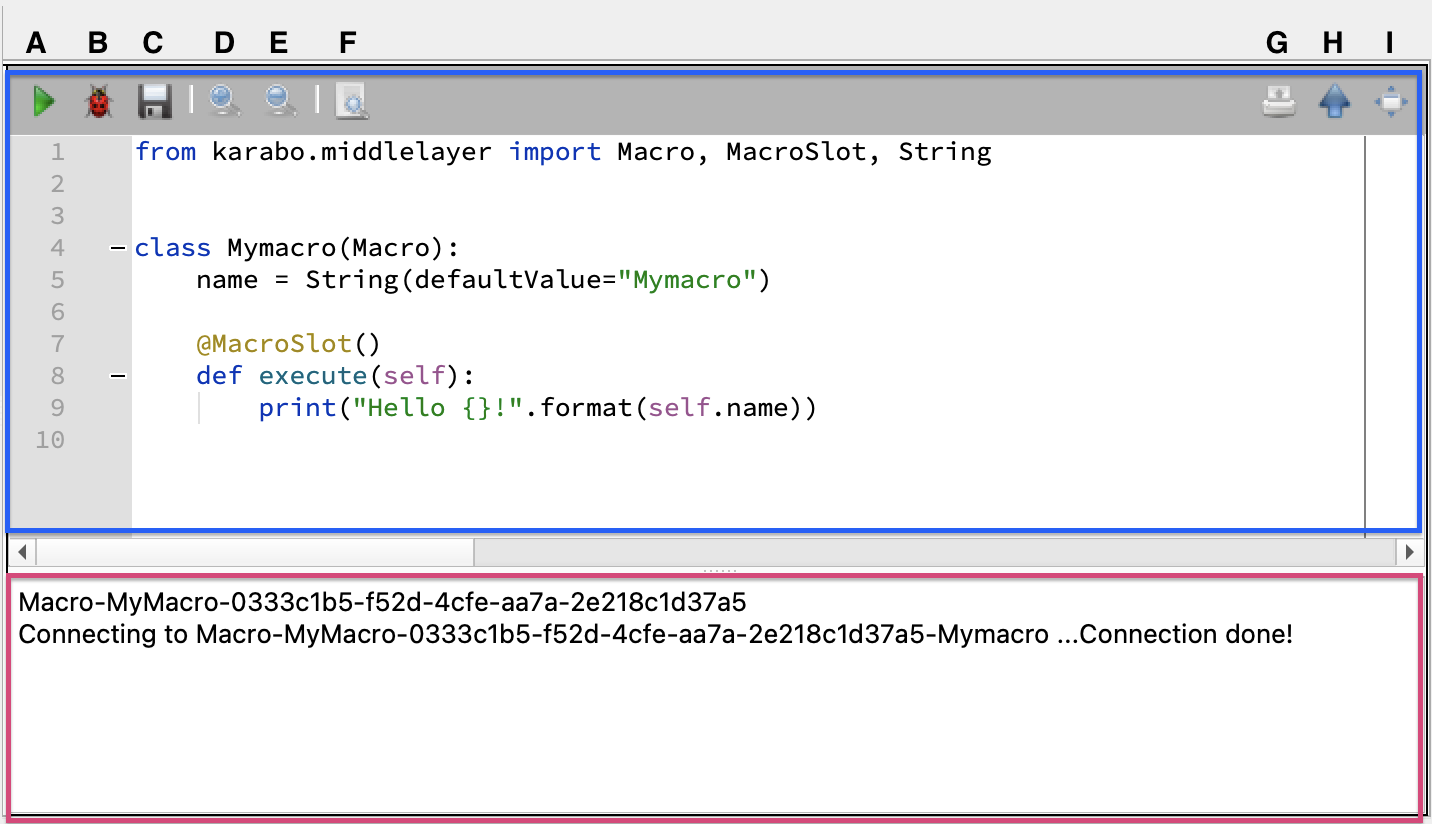
Macro Panel
This panel consists of a toolbar, which provides shortcuts to:
A - Create a macro instance.
B - Create a macro instance in debug mode
C - Save Macro to a file.
D - Increase font size.
E - Decrease font size.
F - Check the Code quality.
G - Print the macro panel.
H - Undock the panel.
I - Maximize the panel.
The blue rectangle is the editor where one can view and edit the macro code. For newly-created macros, a default template is shown. This macro has a property called Name and a slot called execute. The red rectangle is a console that shows information about the macro runtime, such as its connection status or its output.
Features in Macro Editor
The Macro Editor offers various convenient features, similar to those found in other code editors, that significantly ease the life of coders.
Code quality checker:
The Code Quality Checker tool button (The button at ‘F’ position in the above image) runs pyflakes and pycodestyle on the code in the editor. Using pyflakes the quality checker analyzes the code and identifier various error, highlighting them with a red squiggly underline. Additionally, pycodestyle checks the code against the style conventions defined in PEP8, marking any inconsistencies in a blue squiggly underline. A comment below the code-line will also be displayed in case of any error or style inconsistency.
The tool button has three different states.

Code Quality Checker: Before running.

Code Quality Checker: With no error.

Code Quality Checker: When any error.
When there is any error or style issue, the tool bar shows an additional button to clear the comment about the error/issue and the underline, from the editor.
Auto-Suggestion:
The editor suggests the possible completions or options on typing at least three letters. It provides intelligent suggestions of names, functions, classes, keywords from the imported and common namespace like “karabo.middlelayer”
Syntax highlighting:
The Macro editor helps to visually distinguish different element of the code - like keywords, variables, strings, comments, by applying different colors/styles to them.
Find and Replace:
The editor provides a Find or/and Replace functionality through a toolbar. The Ctrl+F keyboard shortcut shows the Find toolbar while Ctrl+R shows the Replace toolbar. The toolbar allows to search for the text with case-sensitive option on or off. The tool highlights all the search hits in the editor and displays the total number of search result in the toolbar.
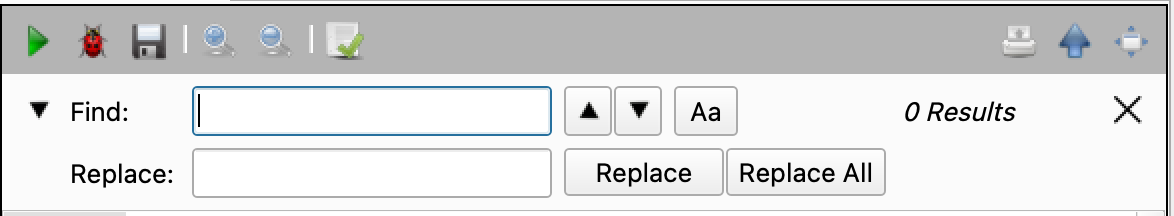
Find Replace Toolbar
Indentation Guide:
The indentation guide- as vertical line on the left side of the code, represents the level of indentation of each line. This helps to easily identify any inconsistencies or error in the indentation.
Line wrap guide:
The vertical line in the editor indicate when a line reaches the Python standard limit of 79 characters.
Code Fold:
The plus and minus icons on the left side- after the line number- enables to expand and fold a code block.
Keyboard shortcuts in Editor
Ctrl+C : Copy the selection
Ctrl+X : Cut the selection
Ctrl+V : Paste from clipboard
Ctrl+Z : Undo the previous action
Ctrl+F : Show Find toolbar
Ctrl+R : Show Replace toolbar
Ctrl++ : Increase font size
Ctrl+- : Decrease font size
Tab : Indent the selected line(s) by four spaces
Shift+Tab : De-indent the selected line(s) by four spaces
Instantiating a Macro
In order to instantiate a macro, the user can either run it from the Project Panel or use the A button from the toolbar. In case there is any error with the writen code, it will be logged in the Log Panel, where the user will have access to its stacktrace, which can help correcting the code.
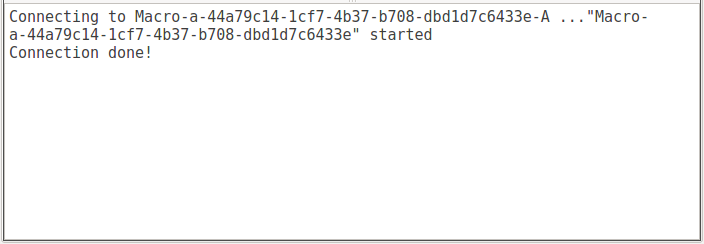
Once it has been instantiated, information about the connection will be shown in the console window (red rectangle).
Its instance is accessible via the Project Panel where, after selected, will show its configuration in the Configuration Panel:
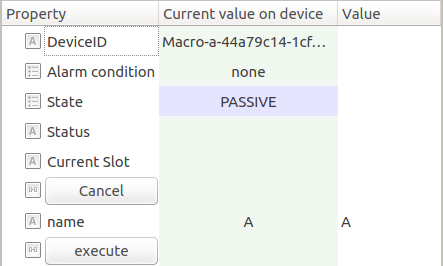
This panel shows the macro default properties (State, Status, etc) and also the user-defined properties (only Name in this example). Also, the execute slot is provided as a button for running the macro. The user can provide as many properties and slots as needed.
In this example, clicking the execute slot in the Configuration will print a message containing the name property in the console:
Note
Ideally the tasks executed in a macro should be small, not having long loops or lasting too long. In order to cancel a macro execution, the user can click on the Cancel slot in the Configuration Panel.
Shutting Down a Macro
A macro can be shutdown by means of the Shutdown instance button in the Configuration Panel or also from the Project Panel.
Rerunning a Macro
To reflect changes made to the macro code, it is necessary to first shutdown the current instance (if any) and instantiate it again from the toolbar or the Project Panel.