8. Troubleshooting
This chapter presents a list of the most common problems encountered in running the DSSC detector.
8.1. What to do when
Here is a list of what to check during detector operation to ensure everything is working fine:
Detector status: up and running (sending data)
| Scene | Issue | Action |
DSSC_Power_Status |
Channel red (ERROR) | Call DET OCD immediately. Switch OFF power with All Off button in the MAIN scene |
DSSC_Power_Status |
Channel yellow (UNKNOWN) | Call DET OCD immediately. MPOD has lost connection with Karabo and can no longer be controlled This is however not an emergency situation, but the detector cannot be switched OFF as control is disconnected. |
DSSC_HV_Status |
Channel red (ERROR) | Call DET OCD immediately. Switch OFF power with All Off button in the MAIN scene |
DSSC_HV_Status |
Channel yellow (UNKNOWN) | Call DET OCD immediately. MPOD has lost connection with Karabo and cannot be controlled anymore. This is however not an emergency situation, but the detector cannot be switched OFF as control is disconnected. |
SIB |
Crate En. lamps
turn from green to blue
or red during operation |
Call DET OCD immediately. If you cannot reach an expert, switch OFF power with All OFF button in the MAIN scene. |
SIB |
ASIC_T status flickering red (value 2) in one or more quadrants | Flickering from time to time is normal if the flickering channel goes back to normal at some point |
SIB |
ASIC_T status stably red (value 2) in one or more quadrants | Open the SIB_ASICTempChecks scene and check
the values. During operation at -20 degC, they should
be at -12 degC (within 2 degC). The threshold is at
-10 degC. If some value is obviously wrong (e.g.,
-50 degC) do not do anything but note down the ASIC
and quadrant number in elog. If some value is between
-10 degC and 10 degC, call DET OCD during the day,
and note down and monitor during the night. If the
value seems to increase, call DET OCD. If some value
is above zero degC, call DET OCD. |
SIB |
ASIC_T status stably red (value 3) in one or more quadrants | Check that the quadrant where the value is 3 is sending data. If data are not sent, this value is normally 3. It should go back to zero when data are sent. |
SIB |
IOB T Status red (status 3) in one or more quadrants | Check that ASICs are ON in the DSSC MAIN panel. If ASICS are OFF, a status 3 there is normal. If ASICS are ON, call DET OCD. |
SIB |
IOB T Status red (status 2) in one or more quadrants | Call DET OCD immediately. Switch OFF power with ALL OFF button in the MAIN scene |
List of NaN in the SIB_ASICTempScene:
For the following ASICs, it is normal to have a NaN readout in the SIB_ASICTempScene:
Q1, Q2 and Q3: No ASIC should have a NaN readout.
Q4: ASIC 9 and 38
8.2. Online preview not updating
If the online preview is not updating anymore, there might be different problems.
Check that the detector is correctly sending data. Go to the individual SCS_CDIDET_DSSC/FPGA/PPT_Qi devices and in the configuration editor, look for ‘SFP output rate’. This should be different from zero, normally a number like 4197 Mbit/s, but it also depends on the VETO configuration. If the number is zero for one of the quadrants, then the quadrant is not sending data. Check the currents, in case press on Stop acquisition and then on Init system.
You can also check the network traffic to the DAQ nodes via the remcom interface. Type https://remcom.desy.de/ on a network browser, log in as SCSDAQ or as SQSDAQ. Click on ‘SCSDAQ(SQSDAQ)’ and then on ‘DAQ data aggregators network traffic’. Select the required data sources (all the scs(sqs)-br-sys-daq-XX, where XX goes from 00 to 15). Then click on ‘Run Job Now’ on the top right side of the screen. The system will give you back the amount of (possible) failures.
Check that DSSC-XTDF is included in the DAQ data sources in the SCS(SQS) run control. If this is not the case, the DSSC data are not sent to the DAQ and therefore cannot be displayed in the online preview.
- If all this looks OK, you might need to restart the calibration pipeline. The procedure is as follows:
- Stop acquisition on all the scences ‘Init_Qi’.
- On the scene
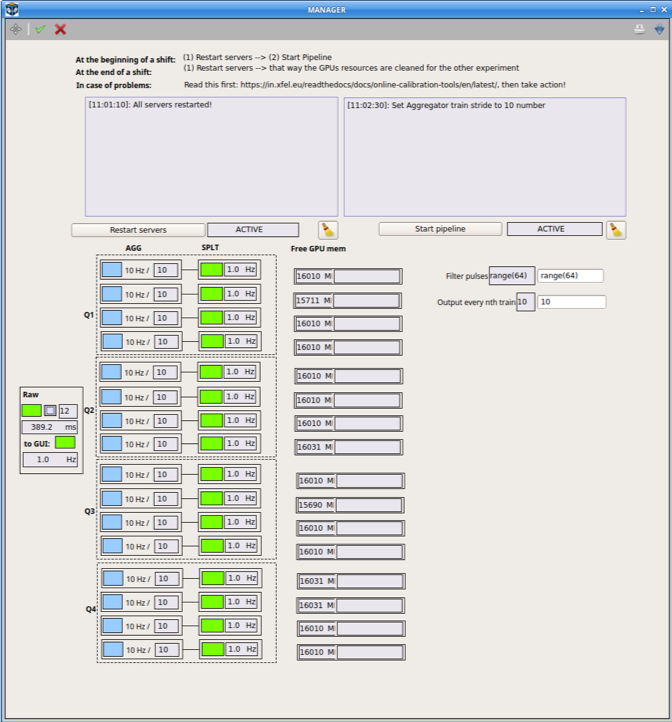
Subprojects\(\rightarrow\)DSSC_ONLINE_CAL\(\rightarrow\)MANAGER, push the button ‘Restart Servers’, and when the process is finished, push ‘Restart Pipeline’. - Check on the
PREVIEWscene that all the modules are displaying data correctly.
8.3. Frames getting IDs up to 810
The problem was solved switching on and off the quadrants. A soft reset of the FPGA on the PPT did not help.
8.4. Restarting the DAQ
SCS(SQS)_DAQ_DSSC: in case the DAQ seems not working, restart the servers under this device (scs(sqs)_daq_0 … scs(sqs)_daq_15). After that, one should restart also online pipeline preview. Follow the procedure below.
Restart DAQ servers (e.g. online preview not updating some module, after restarting online preview)
- Stop sending data from the detector (very important). Use the
Init_Qiscenes.- From https://remcom.desy.de/ , go to reset DAQ.
- Select all nodes (xtdf data nodes 0-15).
- Select NONE of slow data nodes.
- Then, press run job now \(\rightarrow\) Aggregators are then killed.
- Then, go to subproject
SCS(SQS)_DAQ_MACRO.- Choose macro
SCS(SQS)_AUTO_INSTANTIATE.- Run the macro by pressing the green button, macro comes out in the line below.
- In the macro, press start.
- Run controller servers and database devices need to be reinstaintiated by hand (
pythonServers/scs(sqs)_daq_rmdc_1,cppServers/scs(sqs)-daq_rc_1,cppServers/scs(sqs)_daq_conf_1).- At the end, restart the online preview pipeline (scene
ManagerinDSSC_ONLINE_CAL, see manual above).- Select proper proposal and data sources