karaboFAI
The official documentation can be found at karaboFAI readthedocs.
Starting up

In the schematic above one can see the data flowing from the DSSC detector to the train matcher device TRAIN_MATCHER which combines it with the slow data to the ZeroMQ bridge in BRIDGE_MATCHER to the karabFAI gui.
In the Karabo project ZMQ_Bridge instantiate and activate the bridges: SCS_CDIDET_DSSC/DA/TRAIN_MATCHER reads the DSSC data and slow data, see that the “Last trainId” is updating SCS_CDIDET_DSSC/DA/BRIDGE_MATCHER sends the read data to KaraboFAI, see that the “Input updated” is updating
In the terminal ssh to username@exflonc13 then type:
module load exfel exfel_anaconda3/beta
karaboFAI dssc –topic SCS
- Check that the port number in the top right is the same as for the Output in the bridge: SCS_CDIDET_DSSC/DA/BRIDGE_MATCHER
#. Ensure that the geometry file loaded is (the latest one for now / 18.09.19): /gpfs/exfel/sw/software/xfel_anaconda3/beta/lib/python3.7/site-packages/karaboFAI/geometries/dssc_geo_june19.h5
- Choose the Detector source name SCS_CDIDET_DSSC/CAL/APPEND_RAW
- Start the acquisition in KaraboFAI: click the green arrow in the top left
- Ensure that karaboFAI receives the data: in the window below see that the trainID is updated and you can also open the windows “Image tool” and “Overview” and see the updating image there.
- If it is not updating, first, check the port number again.
#. If it is steel not working, go to your folder and remove the config file, type: mv ~/.karaboFAI/config.json ~/.karaboFAI/config.json.bak close KaraboFAI, open it again, it will create a new correct config file as hopefully start updating.
Configure the data source

- Put the good port, and select the source name. During proposal 2212 was those values
- Press the start button (green triangle in the task bar) a new window will appear.
- In that window you can define the ROI. To move them click in the center, to change their size, click on the square in the bottom right corner
- This image is not live. You have to update it.
- You can play with the scale.
- For zooming in out, you can use the scroll button and/or click right and select view all
- To show a picture live, select the picture button in the task bar (or the one next to it?), circled in red here.
- To adjust the scale, stop the acquisition (red square next to the green tringle
- Play with the scale
- Run the view by pressing the start button
Configuring slow data sources
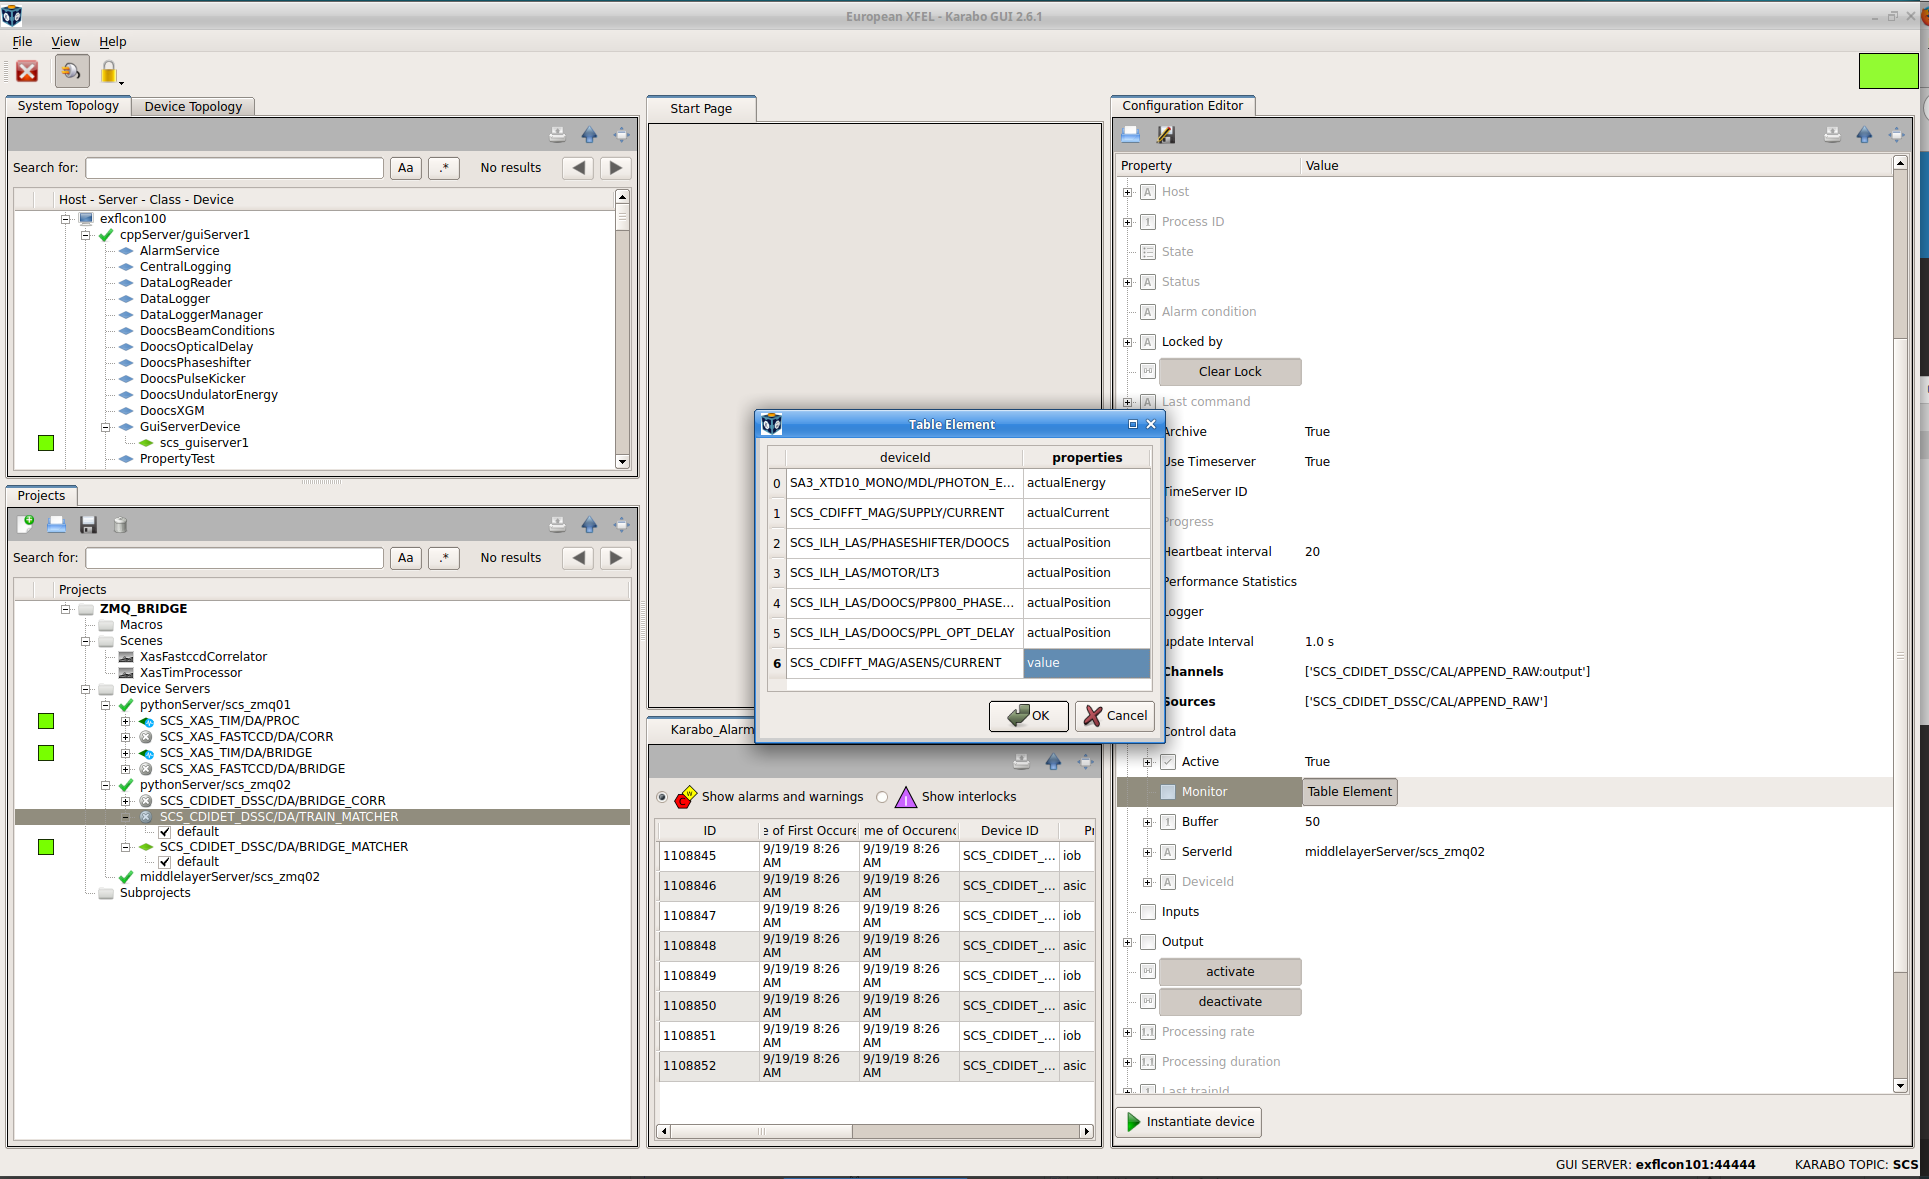
- Deactivate and shut down the Karabo device SCS_CDIDET_DSSC/DA/TRAIN_MATCHER
- In the device go to Control data -> Monitor -> Table Element
- In the table add/change the name of the device and the property
- Close the table, save the project ZMQ_BRIDGE
- Reinstantiate and activate the device SCS_CDIDET_DSSC/DA/TRAIN_MATCHER
#. In the section Correlation setup of the main KaraboFAI window for one of the correlators set the Category to User defined, enter manually the new device name and property in the fields Karabo Device ID and Property Name
Dark normalization

- Record a dark : Press the dark button in the task bar (circle in red) a new window will appear. In that window:
- Trash the already existing dark if there is one
- Make sure there is no photons on the camera (block the beam)
- Press the record button and wait for number of train to be around 20
- Close the window
- The live picture should be much better now.
- If you want to accumulate on several train change the number in M.A. window (red square here). We used 100
Pump-probe configuration

- To separate pictures pump from unpump pictures when running the FEL 2x IR frequency select same train for Mode and then put the python command to select even and odd. Depending the number of frame/train the maximum (32) is the highest number below the number of train in 8/16/32/64/128… (here 50 frames => 32 )
- Select what you want to plot for analysis
- Click on the pump-probe picture in the task bars (red circle). This open a new window with 2 pictures of pump and unpump images and the curve of the projection (or azimuthal integration) for pump and unpump (top right), the difference of that (middle right) and the mean of the difference in fct of train number (bottom right)
Azimuthal integration

- Put the approximative center
- If you want to normalize, you can define a ROI 3 and/or 4
- Then you can plot this azimuthal integration either using the pump-probe setup or the binning or correlation. Just select it in the blue rectangle
Normalization by ROI

- If you want to normalize by an area on the DSSC (gratings in our case), define a ROI 3 in the first window opened when click start green button
- Then in ROI 1D proje… in the normalizer part, select ROI3 (ROI3+ROI4 was not working so far…)
- Then when using analysis type ROI1(pros), it means the ROI1 is divided by the mean of ROI3
Ploting ROI or Azimuthal Integration versus slow data

If you want to look at the ROI or the azymut in function of a motor you have to define the parameter (rectangular box) and select the item in the task bar (circle) to open a new window. You can
- Use binning (red), it will plot the projection of ROI or azymut so a 1D curve in function of the motor =>results is a 2d pictures, as well as the mean of this 1D curve (FOM) in function of motor => results is 1D curve. It will average all the data for one motor positions
- Use correlation (blue) where it will plot the FOM in function of the motor. It will plot all points for one motor positions
For both you have to:
- Define a category (monochromator or user defined)
- Select the karabo Device ID or enter the doocs address (in blue box, for the phase shifter i.e. delay scan)
- Property name is in general “actual position”
- For binning, you have to select the value range (i.e. 774, 780 for energy scan) and the # of bins
- For correlation, you can regroup the data per motor positions by increasing the resolution