#6 PhaseOut Qwt
Phasing out Qwt and Matplotlib Widgets from the Karabo GUI Client
The karabo graphical user interface (GUI) currently uses three different plotting libraries, namely Qwt, matplotlib and PyQtGraph. The library Qwt was not fulfilling the demands in the past with regard of configuration storage, tailorable tools such as region of interest settings, linked aux plots, etc. Moreover, it uses a C++ backend, which we consider widely as technical debt in our future plans. The library matplotlib is not the best choice for fast plotting and interactive features.
For this reason, we implemented each existing Qwt plot widget using the
library PyQtGraph and tailored the features to the feedback we received so far.
The MultiCurve widget from matplotlib will get its graph counterpart
in Karabo 2.8.0 in March.
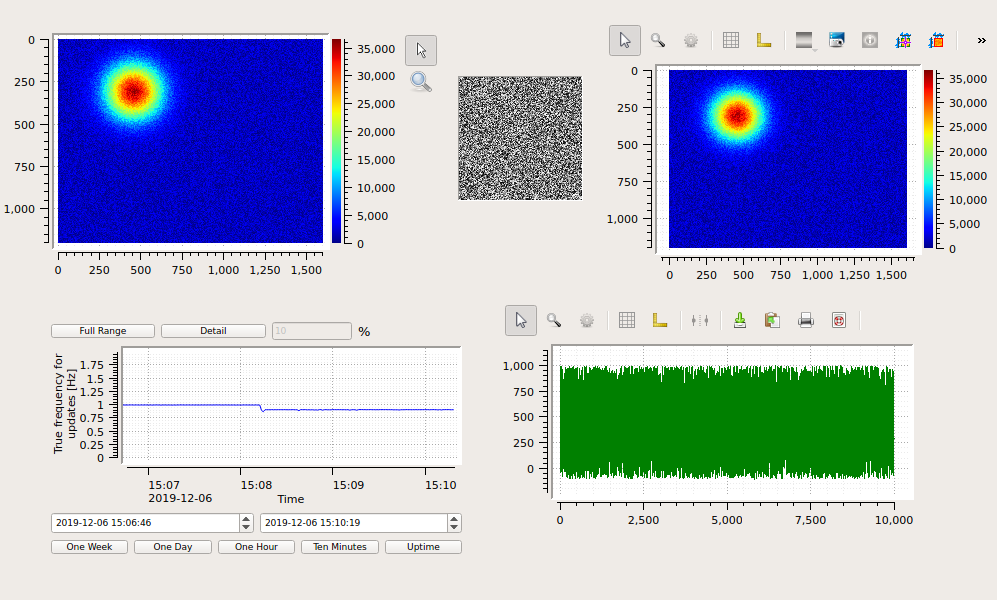
Old plotting widgets using the library Qwt.
Widget Table |
|||
|---|---|---|---|
Type |
Qwt |
Matplotlib |
PyQtGraph |
Vector |
Plot |
Vector Graph |
|
Vector |
XY-Plot |
Vector X-Y Scatter |
|
Vector |
VectorRoll Graph |
||
Vector |
Vector Histogram Graph |
||
Vector |
Vector Bar Graph |
||
Vector |
Vector Fill Graph |
||
Image |
Aligned Image View |
Detector Graph |
|
Image |
Image Element |
WebCam Graph |
|
Image |
Image View |
Image Graph |
|
Image |
Webcam Image |
WebCam Graph |
|
Image |
Scientific Image |
WebCam Graph |
|
Float/Bool/Int |
XY-Plot |
Scatter Graph |
|
Float/Bool/Int |
MultiCurve |
Development … |
|
Float/Bool/Int |
Trendline |
Trend Graph |
|
States |
State Graph |
||
Alarms |
Alarm Graph |
||
In order to move further, we will finally deprecate and remove the Qwt and matplotlib widgets with Karabo 2.9.0, which will be released 15.05.2020. We are aiming for an automatic procedure with a script working on the project database content to replace the existing Qwt and matplotlib widgets with their PyQtGraph counterpart.