#12: ROI Items in Graphs
ROI Items in the Graph Widgets
The new Graph Widgets offers region of interest (ROI) items for marking and selecting plot regions. These can be hidden, shown, and drawn using the ROI tool button found in the plot toolbar.
Plot Graph and Crosshair ROI
Plot Graphs have Crosshair ROI, which can be used to mark a point in the plot. It can be added with the following steps:
Go to scene control mode (not design mode)
Click the dropdown button next to Crosshair ROI button
Select “Draw Crosshair ROI”.
Click on the desired location in the plot to draw the crosshair
The Crosshair ROI displays its coordinates in a text box right below it.
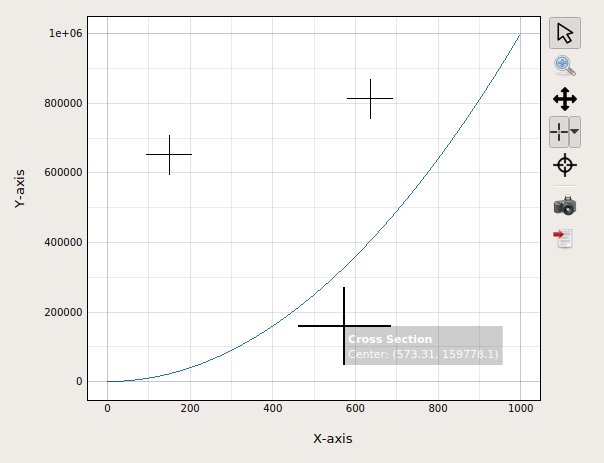
Crosshair ROIs in a Vector Plot
Image Graph and Rectangle ROI
Image Graphs have Rectangle ROI, in addition to the Crosshair ROI. It can be added in the plot with the following steps:
Go to scene control mode (not design mode)
Click the dropdown button next to Rectangle ROI button
Select “Draw Rectangle ROI”.
Drag a rectangle in the plot to draw the ROI
The Rectangle ROI displays its geometry in a text box right below it.
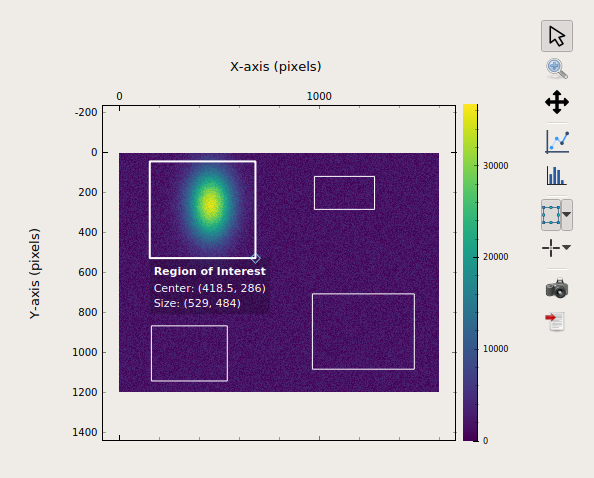
Rectangle ROIs in an Image Graph
The ROIs in the Image graph are capable of automatically slicing the image data and can be used in conjunction with Aux Plots, which is also a provided tool.
Aux Plots gets the data to be analyzed from the ROI slices
The ROI items can also be selected and moved around. They can also be removed from the plot by right-clicking them and select “Remove ROI”. Multiple ROIs can also be added, with a bolder line width for the currently selected ROI.
As of Karabo 2.9.0, only the currently selected ROI displays the text box containing its properties. This is to help minimize innate resize problems and to reduce the items inside the plots.
Saving ROI Items in the Scene
The ROI items can be saved in the widget and can be loaded on the next scene opening.
For the Plot Graphs, this can be done by the following:
Go to scene design mode
Right-click the graph widget
Hover “Vector Plot: Properties”
Select “Set ROI”
Save the project
This saves the location of the ROI items and their visibility. For instance, if a user added three ROIs and then hid them from the plot before setting them and saving the project, the next scene opening will load the three ROIs, but they are hidden initially. One has to toggle the “Show ROI” to make them visible again.
For the Image Graph, the process is very similar to the one above :
Go to scene design mode
Right-click the graph widget
Hover “Vector Plot: Properties”
Select “Set ROI and Aux”
Save the project
This saves not only the ROI geometry and visibility for both Rectangle and Crosshair ROIs, but also the Aux Plots visibility.
The two-step saving process ensures that the scene and project are not modified with every ROI modification, as the ROIs are manipulated in the scene control mode and not in design mode.