#15: AuxPlots in Image Graphs
Auxiliary Plots for Image Graphs
The Image Graphs currently have two auxiliary plots (aux plots) that offer quick analysis and visualization on the displayed image data:
Beam Profile
Histogram
These plots can be toggled from the image widget toolbar:
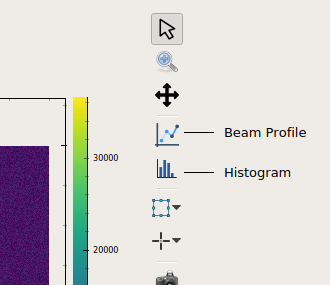
The aux plots tool buttons in the image widget
Beam Profile
The profile aux plot provides the intensity profile of the image by taking the average of the data for each axis. It consists of two plots, which are found on the left and on the top of the image plot for x- and y-axis, respectively.
A Gaussian fit can also be applied to the resulting data to obtain important features such as peak amplitude and position, and full width at half maximum (FWHM). This works best when an evident peak is present.
The beam profile aux plots with Gaussian fitting enabled
The fitting is disabled by default and can be toggled with the following steps:
Go to scene control mode
Show the beam profile aux plot by clicking the beam profile tool button
Right-click on one of the profile plots
Select “Gaussian fitting”
As fitting data is a computation intensive task, enabling this option might make the GUI slow. It is recommended to use it sparingly.
Histogram
The histogram aux plot calculates and visualizes the histogram of the displayed image data. The bin width and count are automatically calculated based on the pixel values and count. It also generates statistics such as the minimum, maximum, mean, mode and standard deviation.

The histogram aux plots
The statistics is enabled by default and can be toggled with the following steps:
Go to scene control mode
Show the histogram aux plot by clicking the histogram tool button
Right-click the histogram plot
Select “Show statistics”
Saving Aux Plots Visibility
The visibility of aux plots can be saved in the project such that they are shown or hidden by default on the next scene opening. This can be done with the following:
Go to scene control mode
Show or hide the desired aux plot by clicking the consequent tool button
Go to scene design mode
Hover “Image Graph: Properties”
Select “Set ROI and Aux”
Save the project
Interaction with ROIs
The region of interest (ROI) tool can be used in conjunction with the aux plots as it is capable of slicing the image data. The aux plots analyzes the sliced data from the selected ROI, when present.
Aux Plots gets the data to be analyzed from the ROI slices
Changing the selected ROI also changes the analyzed data by the aux plots
Limitations of Data Analysis in Karabo GUI
Karabo GUI focuses on providing an interface for controls and data acquisition. It uses the computational resources of the machine where it is run. To ensure smooth and reliable feedback, heavier processes are done with Karabo devices. These devices are run on remote servers, which has more available resources.
The image widget offers quick data analysis. As it is considered a computation
intensive task, it is not activated by default and the results cannot be stored.
It is recommended to use Karabo devices such as imageProcessor.