#22: Plot Graph Improvements
The plot widgets have been improved since the last major release (2.9.0).
Decrease in whitespaces around the plots
Axis tick spacing enhancement for small plots
Log-scale for Vector Bar Graph
These updates are now included from Karabo GUI 2.9.6.
Decrease in whitespaces around the plots
There are cases that there are unintended whitespaces around the plot widget, specifically where the axis labels are located. This has now been removed.
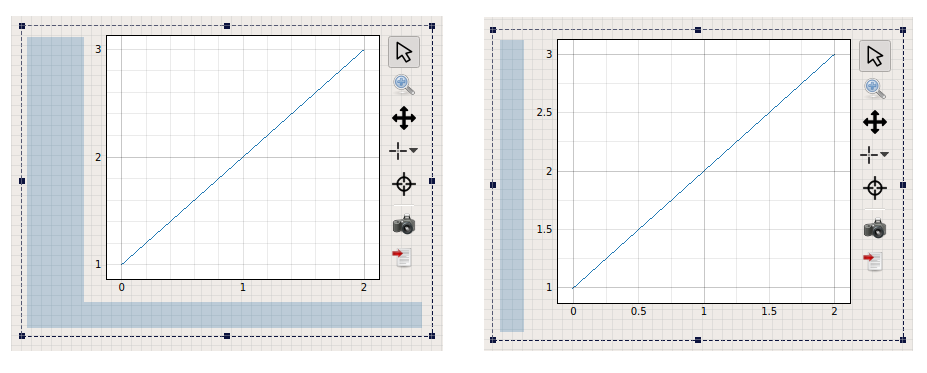
The plots from previous releases have noticable whitespaces (left). This has now been minimized on the new release (right).
It can be seen that there still have some spaces on the y-axis. This is a buffer
for long labels (e.g., 1000000) and will help minimize widget resize
for value updates that involve drastic change in tick label sizes.
For instance, a y-axis with range 0 - 10 changing to range 10000 - 50000,
even though differing in number of digits, will not trigger widget resize.
Axis tick spacing optimization for small plots
Small plots had problems displaying the axis ticks, especially if the labels are going to be too crowded on the available axis space. We have improved the tick spacing calculation such that the labels are shown despite the limited space.
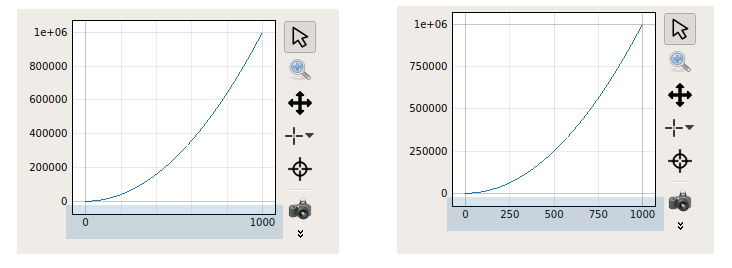
The axis ticks from previous releases does not display all the axis labels when there is not enough space (left). Calculation of the tick spaces has been improved on the new release to optimally show tick labels.
Log-scale for Vector Bar Graph
The Vector Bar Graph has been optimized and can now be displayed with a log-scale y-axis.
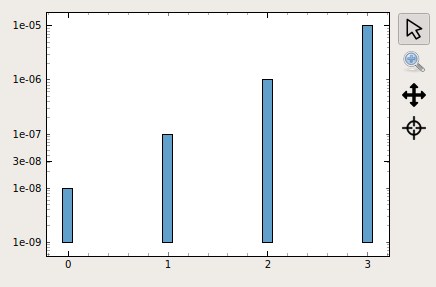
Vector Bar Graph shows a vector in log-y scale.
Please note that no bar will be shown for invalid values (x <= 0)
These improvements were made possible by user feedback, so please feel free to let us know what you think! Should you have suggestions or feature requests, send us a mail at controls-integration@xfel.eu.