#18: ViewBox Plot Features
ViewBox features
The Plot Graphs have a few configurable features which are accessible via
the so-called ViewBox menu which is available by right-clicking
on the plots widgets.
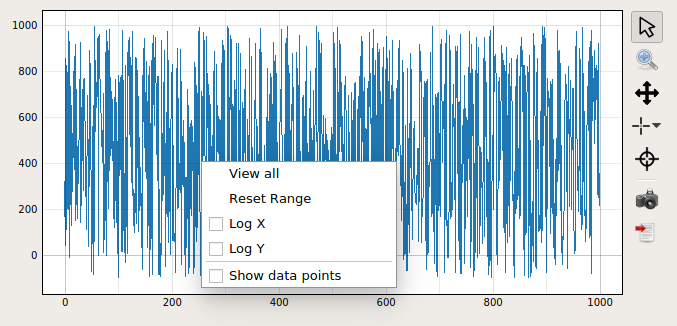
Accessible ViewBox menu of a VectorGraph
View All
Triggering the View All option will auto scale the x and y axis of the plot. The auto scale is active until the range of the plot is changed via mouse interaction or configuration.
Reset Range
The Reset Range option will reset the plot range of the plot. This can be either auto scale or a configured range of the plot.
Log X/Y
If suitable for the plot, a logarithmic toggle is provided on the ViewBox menu. The setting
of this option can be saved in the widget configuration in the project database.
Show data points
For some plots it can be beneficial to see the data points. This is typically the case for the trendline widgets, where this option is activated by default. However, this is an expensive setting as a scatter plot is shown in addition to the line plot consuming cpu processing time. Hence, this option cannot be stored in the widget configuration.