#7: Image Graph Transformations
Image Graph Transformations
The Image Graph provides transformations to further customize the image projection in the plot widget. These options can be accessed by the following actions:
Go to design mode
Right-click the image widget
Hover “Image Graph: Properties”
Select “Transformations”
The transformation dialog will then appear:
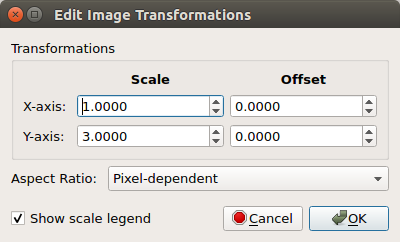
Transformations Dialog
The following values can be set:
Scale - dictates the ratio of the pixel dimensions to its plotted value.
Offset - sets the starting value of the image for each axis
Aspect Ratio - describes the width and height proportion of the image.
“None” will auto-fit the image in the given space
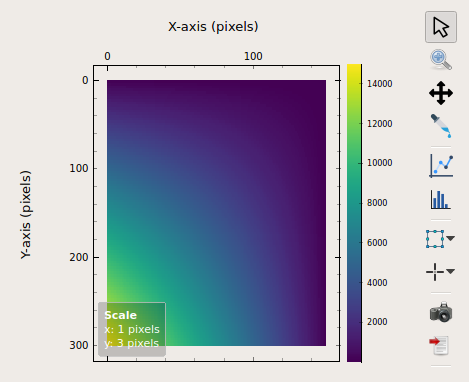
Aspect Ratio: None
“Pixel-dependent” will respect the image dimensions.
This is the most common aspect ratio as it does not modify the appearance of the received image data.
For instance, a
100 x 150image will still have1:1.5ratio regardless of input scale.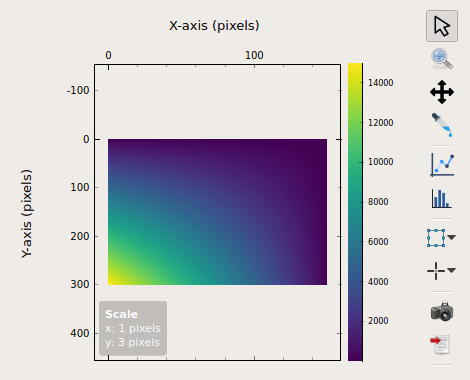
Aspect Ratio: Pixel-dependent
“Scale-dependent” will apply the ratio on the image.
This is a more advanced aspect ratio as it modifies the appearance of the image heavily with the input scale.
For instance, a
100 x 150image will be stretched to satisfy the input scale of1:3.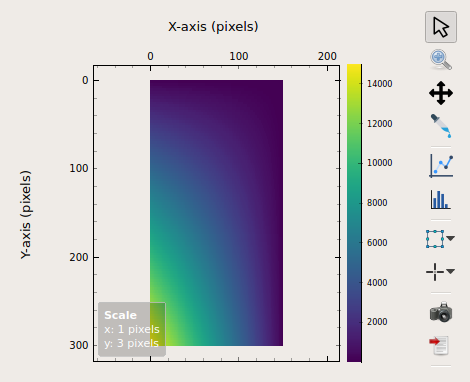
Aspect Ratio: Scale-dependent
The default value is 1:1 scale with no offsets and uses the pixel-dependent
aspect ratio. The scale legend can also be toggled from the dialog.
Use Case: Changing y-axis to mm-scale
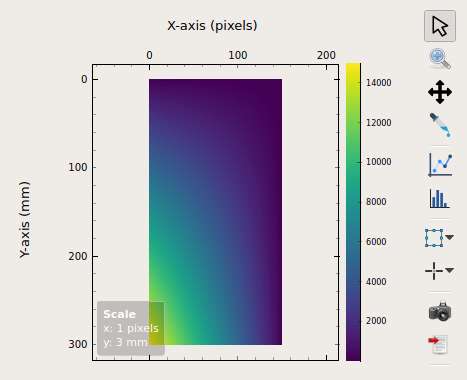
A user wants to change the y-axis of an image to mm-scale, with a 1 pixel : 3 mm ratio. He also wants to adjust the image proportions to the new scale. Then the following can be done:
1. Rename the axis to units of interest (in this case, mm)
Go to design mode
Right-click the image widget
Hover “Image Graph: Properties”
Select “Axes Labels”
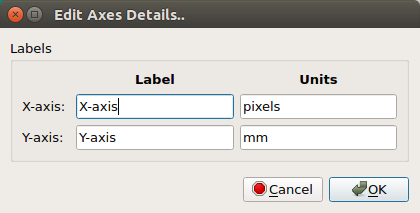
2. Set the transformation factor.
Open the “Transformations” dialog.
Set the y-axis scale to
3Set the aspect ratio to
Scale-dependent. This is to adjust the image proportions.
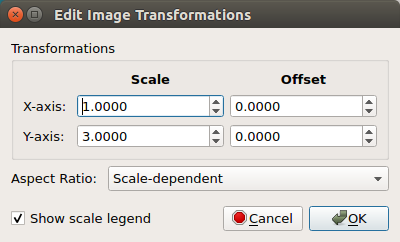
The following image widget is now:
